
Odisha State Board CHSE Odisha Class 12 Education Solutions Chapter 20 Graphical Representation of Data and Measures of Central Tendency Questions and Answers.
CHSE Odisha 12th Class Education Chapter 20 Question Answer Graphical Representation of Data and Measures of Central Tendency
Group – A
Short type Questions with Answers,
I. Answer with in Two/Three sentence:
Question 1.
Why is it essential for a measure of central tendency to be rightly defined?
Answer:
A precisely defined measure ensures uniform interpretation by all individuals, promoting clarity and consistency in its application.
Question 2.
What does it mean for a measure of central tendency to be based on all observations?
Answer:
The measure should consider all data points to accurately represent the central tendency, ensuring that no scores are excluded or ignored.
Question 3.
Why is simplicity in calculation considered a crucial characteristic of a good measure?
Answer:
Simplicity in calculation ensures practicality and ease of use, making the measure accessible and efficient for a wide range of applications.
Question 4.
In statistics, what is sampling, and why should a good measure of central tendency be least affected by fluctuations in sampling?
Answer:
Sampling involves selecting a subset from a population. A good measure should be robust against fluctuations in sampling to ensure its reliability across different subsets, providing consistent results.
Question 5.
What is the primary symbol used to represent the mean of a population, and what symbol is used for the mean of a sample?
Answer:
The mean of a population is denoted by the Greek letter p (pronounced “mue”), while the mean of a sample is represented by X-bar or M.
![]()
Question 6.
What distinguishes the median from the mean in terms of sensitivity to extreme- values?
Answer:
The median is less sensitive to extreme values compared to the mean, making it a more robust measure in the presence of outliers.
Question 7.
How is the median defined in a continuous series, and what does it represent in terms of percentile?
Answer:
The median in a continuous series is the 50th percentile, dividing the distribution into two halves. It represents the value below which 50% of cases lie and above which 50% lie.
Question 8.
What is an outlier, and why might the median be preferred over the mean in the presence of outliers?
Answer:
An outlier is an extreme score in a distribution. The median is less influenced by outliers, making it a suitable choice when extreme values may distort the mean.
Question 9.
What is the mode, and why is it considered easy to obtain?
Answer:
The mode is the value with the highest frequency in a distribution. It is easy to obtain as it can often be identified through observation without complex calculations.
Question 10.
In what situations is the mode particularly useful, and what type of variables can it be applied to?
Answer:
The mode is useful for nominal level variables and can describe the most common scores in a distribution, making it suitable for non-numeric categories such as religion.
II. Answer with in Five/Six sentence :
Question 1.
What are the characteristics of a good measure of central tendency?
Answer:
A good measure of central tendency should be rightly defined, simple to calculate, easy to understand, based on all observations, and least affected by fluctuations in sampling. Rigid definition ensures consistent interpretation, simplicity facilitates practical application, and consideration of all observations enhances representativeness.
Question 2.
Why is the Mean considered the most commonly used measure of central tendency?
Answer:
The Mean is widely used due to its responsiveness to the exact position of each score, sensitivity to extreme scores, and ability to reflect the total of all scores. It is symbolized by ‘M’ or ‘p’ for the population and ‘X-bar’ or ‘M’ for a sample. Additionally, its mathematical properties make it suitable for statistical computations and comparisons.
Question 3.
What is the main limitation of the Mean, and how does it impact its accuracy ? Answer: The Mean is highly sensitive to extreme scores, and a single outlier can significantly distort its value. This sensitivity can lead to a misleading representation of the average, especially when extreme values are present, as demonstrated by its vulnerability to substantial changes based on a single outlier.
Question 4.
How is the Median defined, and what makes it less sensitive to extreme values?
Answer:
The Median is the middle value of a distribution, less sensitive to extreme scores titan the Mean. It represents the 50th percentile, dividing the data into two halves. It is less affected by extreme values, making it a robust measure of central tendency in situations with outliers.
![]()
Question 5.
What are the properties of the Median, and why might it be preferred in certain scenarios?
Answer:
The Median is less sensitive to extreme values, making it suitable for distributions with outliers. It offers a better representation of most scores in cases where extreme values may disproportionately influence the Mean. Its calculation is based on the central item rather than each individual score.
Question 6.
How is the Mode defined, and what role does it play in a distribution?
Answer:
The Mode is the score with the highest frequency in a distribution. It reflects the most common value and can be easily identified through observation. Unlike other measures, the Mode is applicable to nominal level variables, such as the most prevalent religion in a population.
Question 7.
What are the limitations of the Mode and why may it not be stable across different samples?
Answer:
The Mode may not be stable across different samples as it is influenced by sampling fluctuations. It can have more than two modes in a set of scores, and its representation is limited to the most frequent value, ignoring the entire dataset.
Question 8.
How does the Mean respond to changes in the exact position of each score?
Answer:
The Mean is highly responsive to changes in the exact position of each score. Any increase or decrease in the value of a score directly impacts the Mean, reflecting its sensitivity to the position of individual scores.
Question 9.
Why might the Median be preferred over the Me’an in certain situations?
Answer:
The Median might be preferred over the Mean when dealing with distributions that have extreme values. Its resistance to the influence of outliers makes it a more reliable measure in situations where extreme scores could distort the overall central tendency.
Question 10.
What is the significance of having a well-defined measure of central tendency in statistical analysis?
Answer:
A well-defined measure of central tendency ensures consistency in interpretation, simplifies calculations and provides a clear understanding of the average or central value, in a distribution. It enhances the reliability of statistical analyses and supports meaningful comparisons across different datasets.
Group – B
Long Type Questions With Answers
Question 1.
How to calculate the Mean from the dara grouped into a Frequency Distribution?
| Scores | Mid-point X | f | fX |
| 120-122
117-119 114-116 111-113 108-110 105-107 102-104 99-101 96-98 93-95 90-92 |
121
118 115 112 109 106 103 100 97 94 91 |
2
2 2 4 5 9 6 3 4 2 1 |
242
236 230 448 545 954 618 300 388 188 91 |
| N = 40 | Σfx = 4240 |
Answer:
Mean of M = \(\frac{\Sigma f X}{N}=\frac{4240}{40}\) = 106
Question 2.
Calculation of the Mean by the Method of “Assumed Mean” or Short Method.
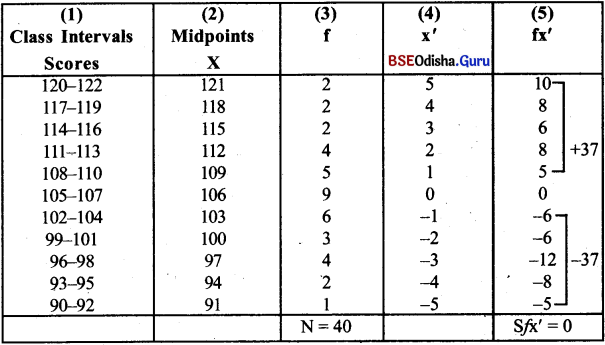
Answer:
M = A.M + ci
M = A.M + \(\frac{\Sigma \mathrm{fx}^{\prime}}{\mathrm{N}}\)i
= 106 + \(\frac{0}{40}\) × 3 = 106
![]()
Question 3.
Calculating Median for Ungrouped Data.
Answer:
For example, the Median of 7, 9, 8, 6, 4, 5, 3 has to be found out. In such condition, the following things shall have to be kept in mind:
(a) The figures shall have to be put in a serial order like this: 3,4,5,(6),7,8,9.
(b) The number of the figures shall be counted. Then one should be added to the number of ligures, and this total will be divided by 2. The figure situated on the spot is Median of the given figures.
(c) A formula for finding the Median of a series of ungrouped scores is:
Median = the \(\left(\frac{\mathrm{N}+1}{2}\right)^{\text {th }}\) measure in order of size
In our illustration, the Median is on the or \(\left(\frac{\mathrm{7}+1}{2}\right)^{\text {th }}\) score, counting, from either end of the series, i.e. 6.0.
Now, If we drop the first score of 3, our series contains six scores.
4,5,6, ↓ 7,8,9
6.5
In this case our median will be the \(\left(\frac{\mathrm{6}+1}{2}\right)^{\text {th }}\) or 3.5<sup>th</sup> score i.e 6.5
Question 4.
Calculating Median for Grouped Data.
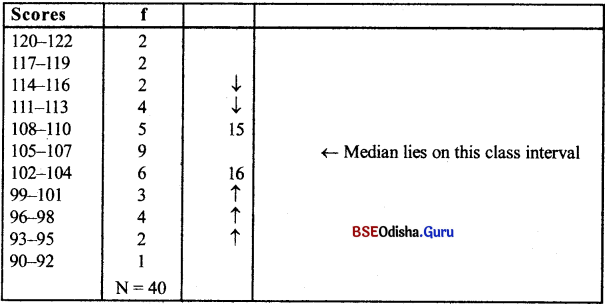
Answer:
In case of Grouped Data, the formula is
Mdn = L + \(\left(\frac{\mathrm{N} / 2-\mathrm{F}}{\mathrm{fm}}\right)\) × i
where, L = Lower limit of the class interval on which the Median lies.
N/2 = One half of the total number of scores or 1/2 of N.
F = Sum of the scores of all intervals below L
fm = Frequency (No. of scores) within the interval upon which the Median falls.
i = Length of class interval.
Here L = 104.5 N = 40 F = 16 fm = 9 i = 3
Mdn = L + \(\left(\frac{\mathrm{N} / 2-\mathrm{F}}{f m}\right)\) × i
= 104.5 + \(\left(\frac{20-16}{9}\right)\)3
= 104.5 + \(\left(\frac{4}{9}\right)\) × 3
= 104.5 + 1.33
= 105.83
Group – C
Objective type Questions with Answers
I. Multiple Choice Questions with Answers :
Question 1.
What is the primary purpose of measures of central tendency?
(i) To create data distributions
(ii) To identify outliers
(iii) To describe the characteristics of the entire dataset
(iv) To calculate the range of the data
Answer:
(iii) To describe the characteristics of the entire dataset
Question 2.
How did English & English (1958) define a measure of central tendency?
(i) A numerical value calculated from a set of related observations
(ii) A statistic derived from a set of distinct and independent observations
(iii) A data point representing the center of the dataset
(iv) A descriptive value calculated from a population sample
Answer:
(ii) A statistic derived from a set of distinct and independent observations
Question 3.
According to Chaplin (1975), what does central tendency refer to?
(i) The average of a distribution of scores
(ii) The spread of data points
(iii) The outliers in a dataset
(iv) The range of a dataset
Answer:
(i) The average of a distribution of scores
Question 4.
What is one function of measures of central tendency?
(i) Generating diverse data points
(ii) Reducing large data into a single value
(iii) Highlighting outliers in the dataset
(iv) Compiling a variety of descriptive statistics
Answer:
(ii) Reducing large data into a single value
![]()
Question 5.
In psychology, what does the mean of a sample provide insight into?
(i) The outliers in the population
(ii) The distribution of scores
(iii) The mean of the population
(iv) The standard deviation of the population
Answer:
(iii) The mean of the population
Question 6.
How do measures of central tendency aid in decision-making?
(i) By creating variability in data
(ii) By providing a single representative value
(iii) By emphasizing outliers
(iv) By calculating the standard deviation
Answer:
(ii) By providing a single representative value
Question 7.
What does the concept of central tendency help in estimating and planning?
(i) Identifying outliers
(ii) Planning for water resources
(iii) Creating diverse datasets
(iv) Generating multiple summary figures
Answer:
(ii) Planning for water resources
Question 8.
How do measures of central tendency facilitate comparison?
(i) By highlighting outliers
(ii) By providing a single value to represent data
(iii) By creating variability in datasets
(iv) By emphasizing extreme values
Answer:
(ii) By providing a single value to represent data
Question 9.
In the example with the IQ test and video games, what did the average IQ suggest?
(i) Video games have no impact on mental functioning
(ii) Video games negatively impact mental functioning
(iii) Video games improve mental functioning
(iv) Video games are unrelated to IQ
Answer:
(iii) Video games improve mental functioning
Question 10.
How can measures of central tendency be used for comparing groups over time?
(i) By focusing on extreme values
(ii) By calculating the range of the data
(iii) By providing a single representative value
(iv) By emphasizing outliers in each group
Answer:
(iii) By providing a single representative value
Question 11.
What is the purpose of statistical distribution in statistics?
(i) Representing gender ratios
(ii) Describing the properties of data distribution
(iii) Calculating probability density functions
(iv) Arranging data in a frequency table
Answer:
(ii) Describing the properties of data distribution
![]()
Question 12.
In statistical distributions, what are the two main types mentioned?
(i) Discrete and Continuous
(ii) Male and Female
(iii) Mean and Median
(iv) Odd and Even
Answer:
(i) Discrete and Continuous
Question 13.
What characterizes a discrete random variable distribution?
(i) Precise, isolated numerical values
(ii) Values within an interval or span
(iii) Male and female categories
(iv) Probability density functions
Answer:
(i) Precise, isolated numerical values
Question 14.
In a continuous random variable distribution, what is another term used for it?
(i) Discrete distribution
(ii) Median distribution
(iii) Probability density function
(iv) Range distribution
Answer:
(iii) Probability density function
Question 15.
How is the mean calculated for discrete data?
(i) Adding middle items and dividing by two
(ii) Using a formula with an unbroken interval
(iii) Adding up all scores and dividing by the number of scores
(iv) Dividing scores by the sum of X1 + X2 +
Answer:
(iii) Adding up all scores and dividing by the number of scores
Question 16.
What is the midpoint of a series of data called?
(i) Range
(ii) Mode
(iii) Median
(iv) Mean
Answer:
(iii) Medina
Question 17.
If a discrete data set has an even number of scores, how is the median calculated?
(i) Taking the average of the middle two items
(ii) Adding the middle two items
(iii) Using the formula X1 + X2 +… / Xn
(iv) Ignoring the middle two items
Answer:
(i) Taking the average of the middle two items
Question 18.
What is the mode of a distribution with a discrete random variable?
(i) Value that occurs the most often
(ii) Average of all scores
(iii) Middle item in a series
(iv) Probability density function
Answer:
(i) Value that occurs the most often
![]()
Question 19.
How is the mode calculated for a distribution with a continuous random variable?
(i) Using the formula X1 + X2 + …
(ii) Taking the average of the middle two items
(iii) Using a specific formula (to be covered in another unit)
(iv) Ignoring the middle two items
Answer:
(iii) Using a specific formula (to be covered in another unit)
Question 20.
What is a distribution with two modes called?
(i) Unimodal
(ii) Bimodal
(iii) Trimodal
(iv) Multimodal
Answer:
(ii) Bimodal
Question 21.
In a continuous distribution, what is the 50th percentile item called?
(i) Mean
(ii) Median
(iii) Mode
(iv) Range
Answer:
(ii) Median
Question 22.
What is the primary difference between discrete and continuous random variable distributions?
(i) Discrete has isolated values, while continuous has values within an interval
(ii) Discrete is for males, while continuous is for females
(iii) Discrete is for mode, while continuous is for mean
(iv) Discrete is for median, while continuous is for range
Answer:
(i) Discrete has isolated values, while continuous has values within an interval
Question 23.
Which term refers to the average of all the scores in a distribution?
(i) Mode
(ii) Median
(iii) Mean
(iv) Range
Answer:
(iii) Mean
Question 24.
If a distribution with a discrete random variable has more than one mode, what is it called?
(i) Bimodal
(ii) Unimodal
(iii) Trimodal
(iv) Multimodal
Answer:
(i) Bimodal
II. Fill in the Blanks
Question 1.
The definition of the measure of Central tendency should be so clear that it should lead to _____ by all persons.
Answer:
one interpretation
Question 2.
A good measure should be possible to calculate in a simple manner, avoiding too many _____ calculations.
Answer:
complex and high
Question 3.
The measure of central tendency, irrespective of it being mean, mode, or median, must be easily understandable in terms of what it conveys.
Answer:
True
Question 4.
A good measure of central tendency should be based on _____ .
Answer:
all observations
Question 5.
The central tendency should take into consideration all the scores to avoid bias in the measure. Leaving out extreme scores may lead to an incorrect _____.
Answer:
measure
![]()
Question 6.
Sampling is the term used when taking a _____ from a population for study.
Answer:
sample
Question 7.
The most commonly used measures of central tendency in psychology are the _____, _____, and _____.
Answer:
Mean,- Median, and Mode
Question 8.
The arithmetic mean is the sum of all scores divided by the total number of scores. The symbol for the mean is _____ for the population and _____ for a sample.
Answer:
μ(mue), X(X-bar or M)
Question 9.
The mean is responsive to the exact position of each score, and it is sensitive to the presence (or absence) of _____ scores.
Answer:
extreme
Question 10.
The mean is the best choice when a measure of central tendency should reflect the _____ of the scores.
Answer:
total
Question 11.
The mean is often incorporated implicitly or explicitly in further statistical computations because it fits well with other _____ and _____.
Answer:
formulas, procedures
![]()
Question 12.
One of the important limitations of the mean is its sensitivity to _____.
Answer:
extreme scores
Question 13.
The median is the value that divides the distribution into two halves and is less sensitive to in _____ the distribution.
Answer:
extreme values
Question 14.
The median is less sensitive to extreme values in the distribution, making it a better choice when dealing with _____.
Answer:
Outliers
Question 15.
The mode is the only measure of central tendency that can be used for _____ level variables.
Answer:
Nominal
Question 16.
Mode is not stable from sample to sample and is more affected by _____.
Answer:
Sampling fluctuation
Question 17.
There may be more than two modes for a particular set of scores, creating a _____ distribution.
Answer:
Multimodal
II. Correct the Sentences:
Question 1.
A good measure of central tendency should be rightly defined.
Answer:
A good measure of central tendency should be rigidly defined.
Question 2.
Definitions of measures of central tendency should be so clear that it leads to one interpretation by all persons.
Answer:
Definitions of measures of central tendency should be so clear that they result in one interpretation by all persons.
Question 3.
Measures of central tendency should be possible to calculate in a simple manner; too many complex calculations will not make the measure good.
Answer:
Measures of central tendency should be possible to calculate in a simple manner; too many complex calculations will hot make the measure good.
Question 4.
The central tendency should be based on all observations.
Answer:
The central tendency should be based on all observations.
![]()
Question 5.
The measure of central tendency must be based on all obseryations; leaving out extreme values may lead to incorrect results.
Answer:
The measure of central tendency must be based on all observations; leaving out extreme values may lead to incorrect results.
Question 6.
In sampling, if two samples are randomly selected from the same population, the value of average for both of them should be exactly the same.
Answer:
In sampling, if two samples are randomly selected from the same population, the values of average for both of them should be near to each other.
Question 7.
The mean is the sum of all the scores in a distribution divided by the total number of scores.
Answer:
The mean is the sum of all the scores in a distribution divided by the total number of scores.
Question 8.
The mean is not responsive to the exact position of each score.
Answer:
The mean is responsive to the exact position of each score.
Question 9.
The median is the value that divides the distribution into two halves.
Answer:
The median is the value that divides the distribution into two halves.
Question 10.
The median is less sensitive to extreme values in the distribution.
Answer:
The median is less sensitive to extreme values in the distribution.
IV. Answer the following questions in one word :
Question 1.
What is statistical distribution used to describe in a population?
Answer:
Data distribution
Question 2.
What are the two main types of statistical distributions?
Answer:
Discrete and continuous
Question 3.
What does the mean represent in a distribution?
Answer:
Average
Question 4.
In a continuous distribution, what is another term for the mean 7
Answer:
Probability density function
Question 5.
How is the mean calculated for discrete data?
Answer:
Sum of scores divided by the number of scores What is the midpoint of a series of data called?
Answer:
Median
Question 6.
If a data set has an even number of scores, how is the median calculated?
Answer:
Average of the middle two items
![]()
Question 7.
What does the mode represent in a distribution?
Answer:
Most frequent value
Question 8.
What is a distribution with two modes called?
Answer:
Bimodal
Question 9.
What is the 50th percentile item in a series called?
Answer:
Median
Question 10.
What term is used when taking a sample from a population for study?
Answer:
Sampling
Question 11.
What does the mean symbol (p) represent in a population?
Answer:
Mean of the population
Question 12.
What is the primary limitation of the mean?
Answer:
Sensitivity to extreme values
Question 13.
What is the median value in a series that divides it into two halves?
Answer:
Median
Question 14.
What does the mode measure in a distribution?
Answer:
Maximum frequency
![]()
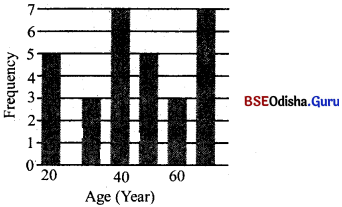
Histogram : A histogram is the graphical description of data and is constructed from a frequency table. It displays the distribution method of a data set and is used for statistical as well as mathematical calculations. The word histogram is derived from the Greek word histos which means ‘anything set upright’ and gramma which means ‘drawing, record, writing’. It is considered as the most important basic tool of statistical quality control process. In this type of representation, the given data are plotted in the form of a series of rectangles.
Class intervals are marked along the X-axis and the frequencies along the Y-axis according to a suitable scale. Unlike the bar chart, which is one-dimensional, meaning that only the length of the bar is important and not the width, a histogram is two-dimensional in which both the length and the width are important. A histogram is constructed from a frequency distribution of a grouped data where the height of the rectangle is proportional to the respective frequency and the width represents the class interval.
Each rectangle is joined with the other and any blank spaces between the rectangles would mean that the category is empty and there are no values in that class interval. As an example, let us construct a histogram for our example of ages of 30 workers. For convenience sake, we will present the frequency distribution along with the mid-point of each interval, where the mid-point is simply the average of the values of the lower and upper boundary of each class interval. The frequency distribution table is shown as follows:
The frequency distribution table is shown as follows :
| Class Interval (Years) | Mid-point | f |
| 15 and upto 25 | 20 | 5 |
| 25 and upto 35 | 30 | 3 |
| 35 and upto 45 | 40 | 7 |
| 45 and upto 55 | 50 | 5 |
| 55 and upto 65 | 60 | 3 |
| 65 and upto 75 | 70 | 7 |
Histogram of Age Distrubution
Constructing a Frequency Distribution :
| Age Group (Years) | Frequency |
| 20 to less than 25 | 5 |
| 25 to less than 30 | 15 |
| 30 to less than 35 | 25 |
| 35 to less than 40 | 30 |
| 40 to less than 45 | 15 |
| 45 to less than 50 | 10 |
| Total | 100 |
The number of groups and the size of class interval are more or less arbitrary in nature within the general guidelines established for constructing a frequency distribution. The following guidelines for such a construction may be considered:
(i) The classes should be clearly defined and each of the observations should be included in only one of the class intervals. This means that the intervals should be chosen in such a manner that one score cannot belong to more than one class interval, so that there is no overlapping of class intervals.
(ii) The number of classes should neither be too large nor too small. Normally, between 6 and 15 classes are considered to be adequate. Fewer class intervals would mean a greater class interval width with consequent loss of accuracy. Too many class intervals result in a greater complexity.
(iii) All intervals should be of the same width. This is preferred for easy computations. A suitable class width can be obtained by knowing the range of data (which is the absolute difference between the highest value and the lowest value in the data) and the number of classes which are predetermined, so that: The width of the interval = Range / Number of classes In the case of ages of factory workers where the youngest worker was 20 years old and the oldest was 50 years old, the range would be 50-20 = 30. If we decide to make 10 groups then the width of each class would be: 30/10 = 3 Similarly, if we decide to make 6 classes instead of 10, then the width of each class interval would be: 30/6 = 5
(iv) Open-ended cases where there is no lower limit of the first group or no upper limit of the last group should be avoided since this creates difficulty in analysis and interpretation. (The lower and upper values of a class interval are known as lower and upper limits.)
(v) Intervals should be continuous throughout the distribution. For example, in the case of factory workers, we could group them in groups of 20 to 24 years, then 25 to 29 years, and so on, but it would be highly misleading because it does not accurately represent the person who is between 24 and 25 years or between 29 and 30 years, and so on. Accordingly, it is more representative to group them as: 20 years to less than 25 years, 25 years to less than 30 years. In this way, everybody who is 20 years and a fraction less than 25 years is included in the first category and the person who is exactly 25 years and above but a fraction less than 30 years would be included in the second category, and so on. This is especially important for continuous distributions.
(vi) The lower limits of class intervals should be simple multiples of the interval width. This is primarily for the purpose of simplicity in construction and interpretation. In our example of 20 years but less than 25 years, 25 years but less than 30 years, and 30 years but less than 35 years, the lower limit values for each class are simple multiples of the class width which is 5.
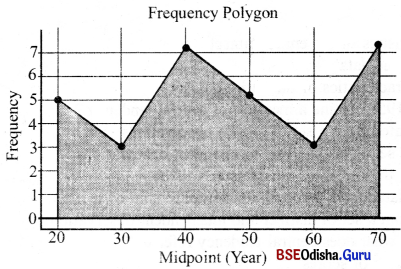
Frequency polygon : A frequency polygon is a line chart of frequency distribution in which either the values of discrete variables or mid-points of class intervals are plotted against the frequencies and these plotted points are joined together by straight lines. Since the frequencies generally do not start at zero or end at zero, this diagram as such would not touch the horizontal axis.
However, since the area under the entire curve is the same as that of a histogram which is 100 per cent of the data presented, the curve can be enclosed so that the starting point is joined with a fictitious preceding point whose value is zero, so that the start of the curve is at horizontal axis and the last point is joined with a fictitious succeeding point whose value is also zero, so that the curve ends at the horizontal axis. This enclosed diagram is known as the frequency polygon.
Pie chart: This type of diagram enables us to show the partitioning of a total into its component parts. The diagram is in the form of a circle and is also called a pie because the entire diagram looks like a pie and the components resemble slices cut from it. The size of the slice represents the proportion of the component out of the whole.
| Item | % Expenditure |
| Labour | 25 |
| Cement, Bricks | 30 |
| Steel | 15 |
| Timber, Glass | 20 |
| Miscellaneous | 10 |