Odisha State Board CHSE Odisha Class 11 Math Solutions Chapter 15 Statistics Ex 15 Textbook Exercise Questions and Answers.
APOLLOTYRE Pivot Point Calculator
CHSE Odisha Class 11 Math Solutions Chapter 15 Statistics Exercise 15
Question 1.
If the values observed are 1, 2, …..,n each with frequency 1, find
(i) the mean value
Solution:
Mean of 1, 2, 3, ….. n
= \(\frac{1+2+3 \ldots . . .+n}{n}=\frac{n(n+1)}{2 n}=\frac{n+1}{2}\)
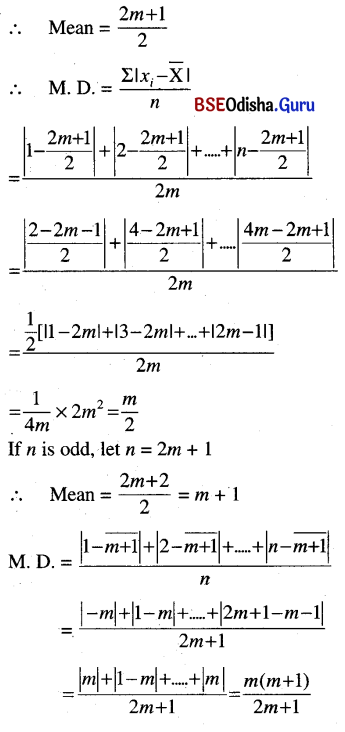
(ii) the mean deviation from the mean separately for two cases when n is odd and when n is even.
Solution:
If n is even, let n = 2m.
Question 2.
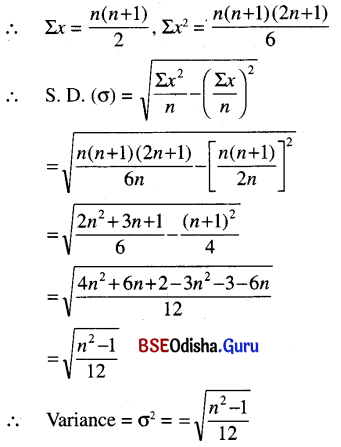
For the same set of values as in (1) above, find the variance and standard deviation.
Solution:
x: 1, 2, 3, ….., n
![]()
Question 3.
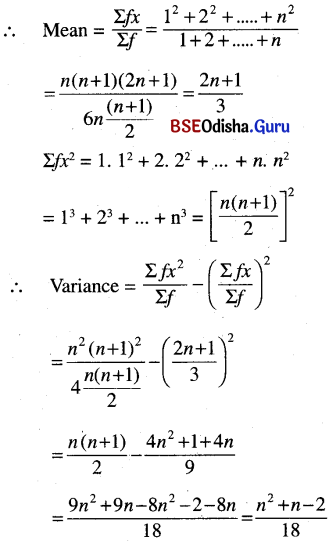
From the table below, find the mean value and the variance.
(a) Values: 1 2 3 ….. n
Frequency: 1 2 3 …. n
Solution:
x: 1 2 3 ….. n
y: 1 2 3 …. n
Question 4.
From the table below, find the mean and the variance.
Solution:
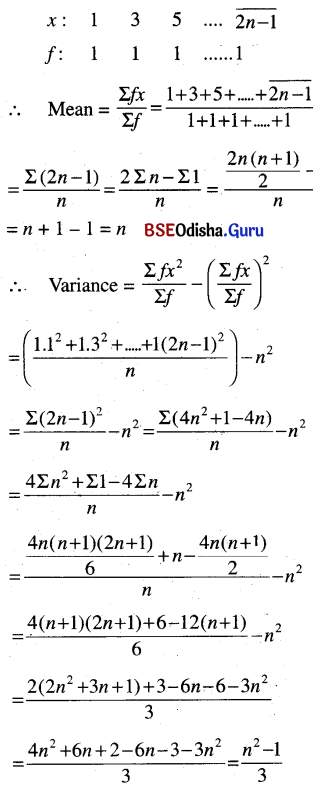
(a) Values: 1 2 5 ….. (2n – 1)
Frequency: 1 1 1 1
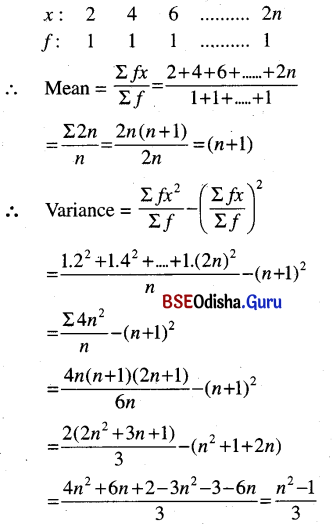
(b) Values: 2 4 6 …..2n
Frequency: 1 1 1 1
Question 5.
From the table below, calculate the mean and the variance
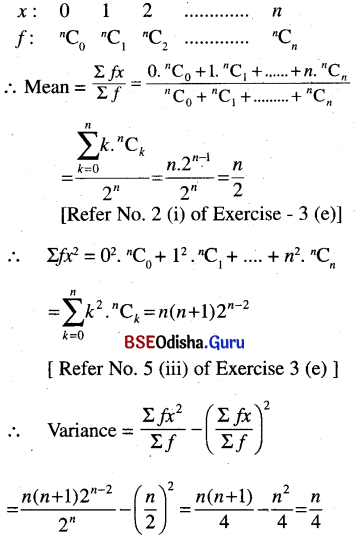
\(\text { Values } \quad \mathbf{0} \quad 1 \quad 2 \ldots \quad r \ldots n\)
\(\text { Frequency: } \quad{ }^n \mathbf{C}_0{ }^n \mathbf{C}_1{ }^n \mathbf{C}_2{ }^n \mathbf{C}_r \ldots . .{ }^n \mathbf{C}_n\)
Solution:
![]()
Question 6.
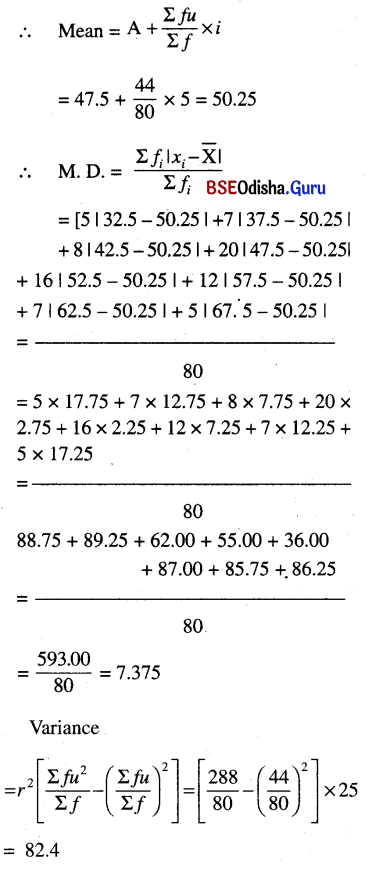
From the following table calculate the mean, mean deviation from the mean, and variance.
| Marks | Number of students |
| 30-35 | 5 |
| 35-40 | 7 |
| 40-45 | 8 |
| 45-50 | 20 |
| 50-55 | 16 |
| 55-60 | 12 |
| 60-65 | 7 |
| 65-70 | 5 |
Solution:
| C. I | f | Mid value (x) | d = x – A |
| 30-35 | 5 | 32.5 | -15 |
| 35-40 | 7 | 37.5 | -10 |
| 40-45 | 8 | 42.5 | -5 |
| 45-50 | 20 | 47.5 | 0 |
| 50-55 | 16 | 52.5 | 5 |
| 55-60 | 12 | 57.5 | 10 |
| 60-65 | 7 | 62.5 | 15 |
| 65-70 | 5 | 67.5 | 20 |
| ∑f = 80 |
Let A (working mean) = 47.5, i = 5
| u = d/i | fu | u2 | fu2 |
| -3 | -15 | 9 | 45 |
| -2 | -14 | 4 | 28 |
| -1 | -8 | 1 | 8 |
| 0 | 0 | 0 | 0 |
| 1 | 16 | 1 | 16 |
| 2 | 24 | 4 | 48 |
| 3 | 21 | 9 | 63 |
| 4 | 20 | 16 | 80 |
| ∑fu = 44 | ∑fu2 = 44 |
Question 7.
In a soccer league, two teams A and B have the following records
A: Goals scored: 0 1 2 3 4
Number of matches: 11 18 8 6 2
B: Goals scored: 0 1 2 3 4 5
Number of matches: 5 20 10 6 3 1
Which team is more consistent? Which is a better team.
Solution:
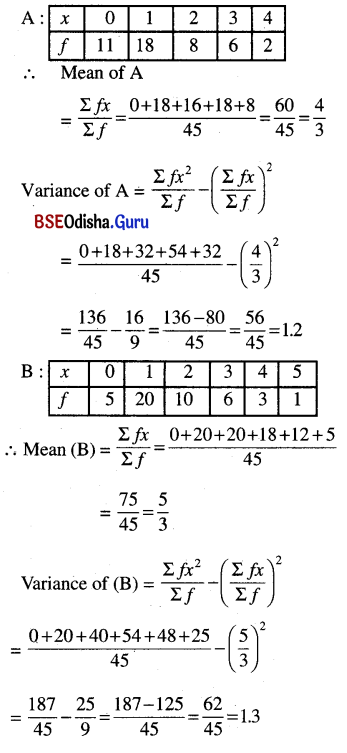
∴ The mean of B is more than that of A, so B is the better team. A is more consistent as its variance is less than that of B.
![]()
Question 8.
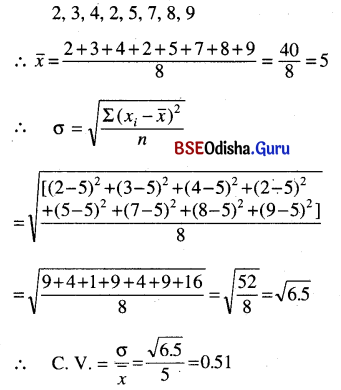
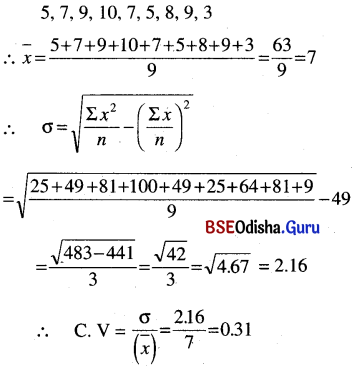
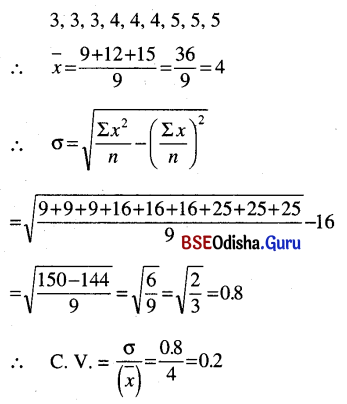
The coefficient of variation is defined as \(\sigma / \bar{x}\), that is the standard deviation divided by the mean value. Find the coefficient of variation c.v. for each of the following sets of observations.
(i) 2, 3, 4, 2, 5, 7, 8, 9
Solution:
(ii) 5, 7, 9, 10, 7, 5, 8, 9, 3
Solution:
(iii) 3, 3, 3, 4, 4, 4, 5, 5, 5
Solution:
Question 9.
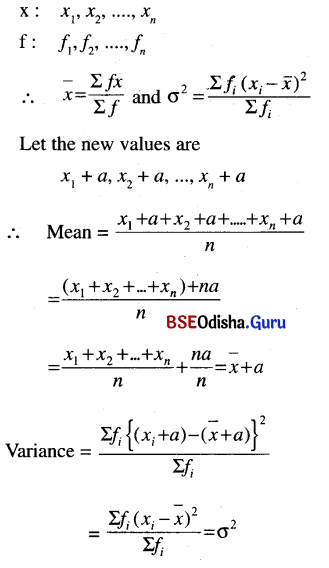
Suppose the values x1, x2, …. xn having frequency f1, f2, …. fn respectively having mean value x̄ and variance σ2. Let a be a fixed real number
x1 + a, x2 + a, ….. , xn + a with frequency f1, f2, ….. fn respectively will have mean value x̄ + a and variance σ.
Solution:
Question 10.
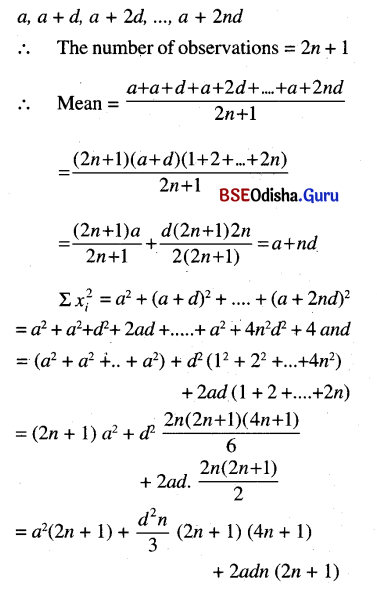
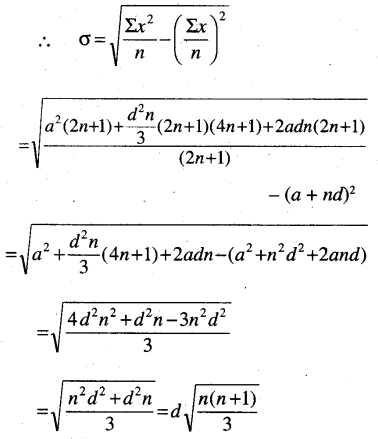
Find the mean and deviation from the mean and the standard deviation of a, a + d, a + 2d, …. , a + 2nd assume that d > 0.
Solution:
Question 11.
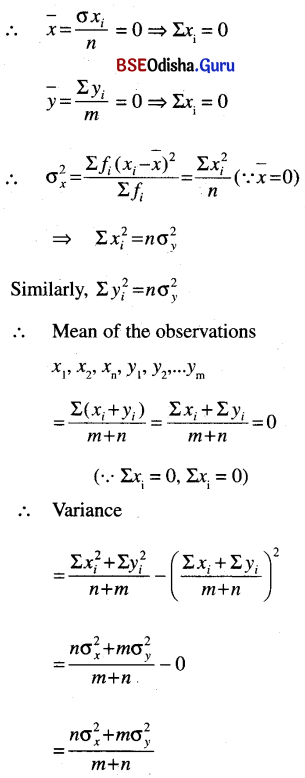
Let x1, x2, …. xn be a set of observations with mean value 0 and variance σ2x and y1, y2, …. ym be another set of observations with mean value 0 and variance σ2y. Find the mean value and variance of the set of observations x1, x2, …. xn , y1, y2, …. ym combined.
Solution:
x1, x2, …. xn be a set of observations with mean value 0 and variance σ2x and y1, y2, …. ym be another set of observations with mean value 0 and variance σ2y
![]()
Question 12.
Find which group of the following data is more dispersed :
| Range | 10-20 | 20-30 | 30-40 | 40-50 | 50-60 |
| (Group A) Frequency |
5 | 1 | 3 | 2 | 1 |
| (Group A) Frequency |
1 | 3 | 2 | 3 | 1 |
Solution:
Let us find the mean and standard deviation for the given two distributions.
(i) Mean deviation about mean
M. D = \(\frac{1}{N} \sum_{i=1}^n f_i\left|x_i-\bar{x}\right|\)
(ii) Mean deviation about median
M. D = \(\frac{1}{N} \sum_{i=1}^n f_i\left|x_i-M\right|\)
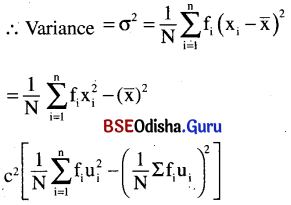
(iii) variance
Variance is the mean of squared deviations from the mean.
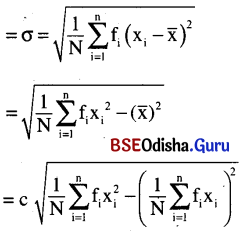
(iv) Standard deviation
Standard deviation is the square root of the mean of squared deviations from the mean.
∴ Standard deviation
Question 13.
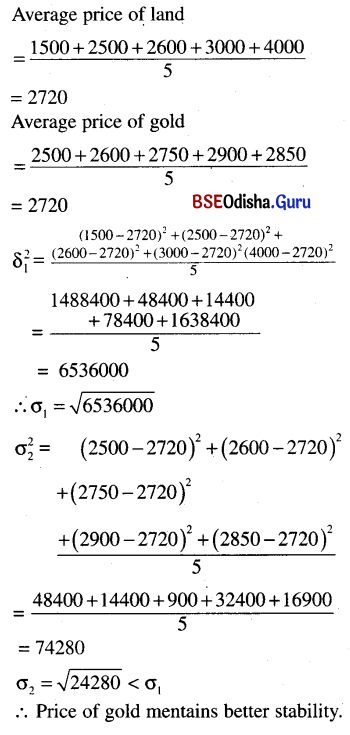
The price of land per square meter and that of gold per ten grams over five consecutive years is given below. Decide, which price maintains better stability. [Hint: Stability ⇔ Consistency]
| Price of land/Sq.meter(₹) | 1500 | 2500 | 2600 | 3000 | 4000 |
| Price of gold/10 gms(₹) | 2500 | 2600 | 2750 | 2900 | 2850 |
Solution:
