
Odisha State Board CHSE Odisha Class 12 Invitation to English 3 Solutions Writing Interpreting Graph, Charts, Tables and Diagrams Textbook Activity Questions and Answers.
CHSE Odisha 12th Class English Writing Interpreting Graph, Charts, Tables and Diagrams
Graphs, charts, tables, diagrams, etc. generally have visual representations so as to enable us to present some information. Visual representations make us understand the information contained therein.
7.1. Diagrams
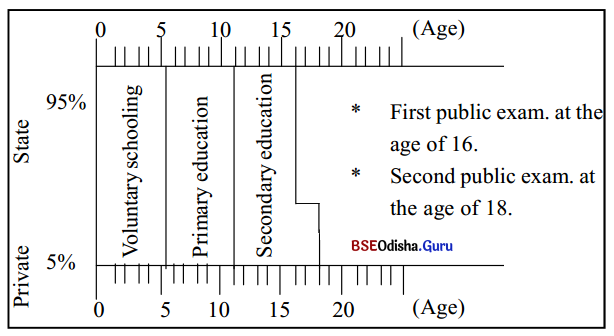
Given below is a diagram of the British School System. Examine it carefully and compare it with the passage given below:
(ii) To test whether you have understood what the diagram presents, see if you can answer the following questions :
Question (a)
How many types of schools there are in England?
Answer:
There are two types of schools in England, namely, Private Schools and State Schools.
Question (b)
What percentage of the pupils go to state-run schools?
Answer:
Ninety-five percent of the students go to state-run schools.
Question (c)
What percentage goes to private schools?
Answer:
Only five percent go to private schools.
Question (d)
When do children start primary education in England?
Answer:
Children start primary education in England at the age of five.
![]()
Question (e)
When do they get into secondary education?
Answer:
They get into secondary education at the age of eleven.
Question (f)
When do they take their first and second public examinations?
Answer:
They take their first and second public examinations at the age of 16 and 18 respectively.
Question (g)
Is pre-primary education compulsory in England?
Answer:
Pre-primary education is not compulsory in England. On the other hand, it is voluntary.
The information found in the diagram is presented below in words.
The British School System
In Britain most schools are financed by the state and for the children attending these schools, they are free. However, about 5 percent of the school population attends private schools, and these are financed from pupils’ fees. For state-run as well as private schools, the general pattern of schooling in Britain is as follows. All children must start school at the age of 5. At the age of 11 children move to different schools, called Secondary Schools, where they are made to go through a set timetable of subjects for a period of 5 years, after which they take their first public examination at the age of 16.
After the first public examination, most pupils leave school. Only about 30 percent continue. Those that stay on spend the next two years concentrating on a small number of subjects. They take their second public examination at the age of 18. In Britain, there is also a provision for pre-primary schooling. However, pre-primary schooling is not compulsory. It is, on the other hand, voluntary, and is offered both by state-run schools and private schools.
The British School System
Most children attend the British School System where schools are directly financed by the State. But on the other hand, nearly 5 percent of children attending schools go to private institutions. But in Great Britain, in the State-run and private educational institutions, children start school at the age of 5 and when they are 11, they go to secondary school. There they are taught to go through a set timetable of subjects for a period of 5 years.
Afterward, they attain their first public examination towards the age of 16. Then after the completion of the first public examination, most students leave schools leaving only 30 percent student- population to continue their studies. Pre-primary education in Britain is yet another feature of education, though not compulsory. Pre-primary education is offered through State-run schools and private schools as well.
![]()
Activity – 1
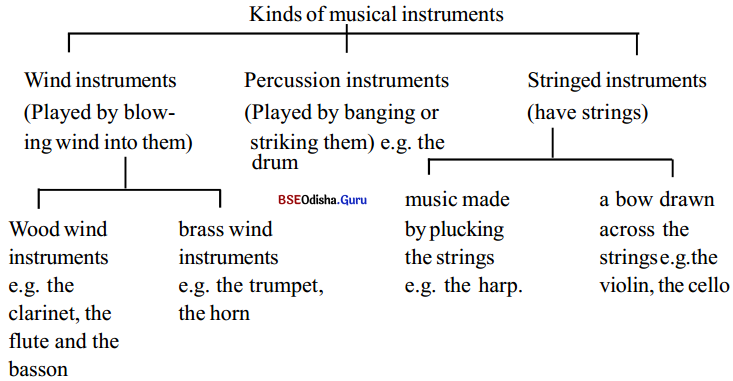
Study the diagram below and write a short passage of about 3 paragraphs on it.
Answer:
Kinds of musical instruments :
Musical instruments are of three types, namely, wind instruments, percussion instruments and string instruments. Wind instruments are those which are played by blowing wind into them while percussion instruments are played by beating or striking them like the drums. String instruments, on the other hand, are those which have strings. Wind instruments can be further classified into wood wind instruments and brass wind instruments.
Examples of the former are the clarinet, the flute and the basson, while examples of the latter are the trumpet, the horn etc. Similarly, string instruments can be classified into two groups on the basis of the method by which music is produced through them. Instruments like the harp which produce music when its strings are plucked belong to one group while instruments like the violin and the cello which produce music when a bow is drawn across its strings belong to another group.
![]()
Activity -2
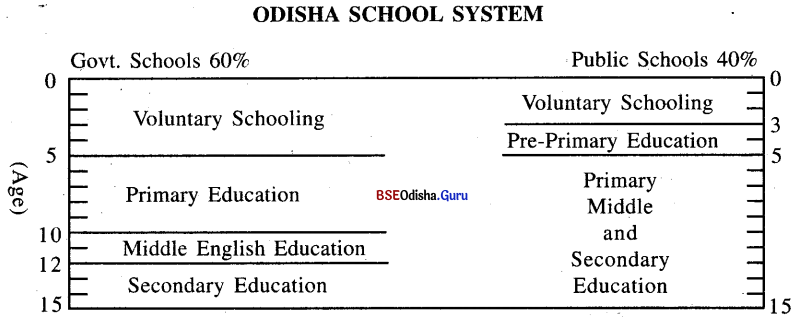
Draw a diagram to present the facts on the school system in Odisha. Then, present the same information in words, in two or there paragraphs, (as has been done above for, the British School System).
Answer:
- Only one public examination at the age of 15.
- First Board examination at the age of ten.
- Second Board examination at the age of 12.
- Third Board examination at the age of 15.
In Odisha there are Public schools which are mostly English medium shcools as well as Government-run schools which teach in the Oriya medium, whereas in the past, Odisha had only Govt, schools and a very few public schools. The gap between the two is closely narrowing as public schools are mushrooming all over the state. As of now, 60% students go to Govt-run schools, while the rest 40% go to public schools. Govt- run schools offer Primary education free of cost and charge very little for Middle-English and Secondary education whereas public schools charge high fees.
Govt. Schools do not offer any pre-primary education. Students start their Primary education at the age of 5 and continue upto class 5 when they take their first public examination. After this they move to Middle English schools where they study for two years till their second public examinations at the age of 12. From here they go to High schools where they study for three years to take the third public examination at the age of 15. Public Schools, on the other hand, offer pre-primary education in the Kinder Garten and Nursery which starts at the age of 3 or 3V4. After this children continue into primary schooling and then till class ten when they take their first public examination at the age of 15.
![]()
Activity – 3
Draw a diagram showing how many streams your college has at the +2 level. Also include information about subjects, papers, practicals etc. in your diagram. Then write a short passage covering all the information in your diagram.
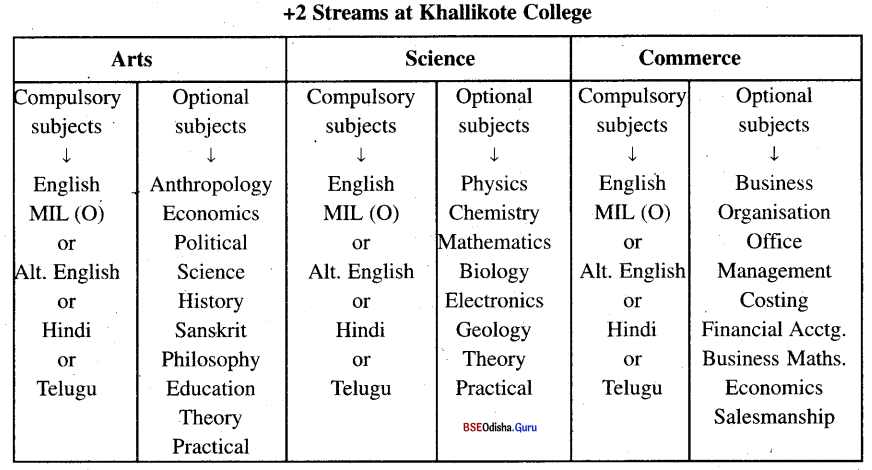
The Khallikote College, Berhampur has three streams, namely Arts. Science and Commerce at the +2 level. All the streams offer teaching in compulsory and optional subjects. While the compulsory subjects are the same for every stream, the optional subjects differ from stream to stream. Among optional subjects too there is a choice of a combination of subjects in each stream with three subjects to be chosen as primary optional and another to be added as a fourth optional.
Further in the Arts stream while only two subjects namely, Education and Anthropology have theory and practical classes; in the Science stream all subjects, except Mathematics, have theory and practical classes. In the Commerce stream there are practicals in no subject. The compulsory subjects for all streams are General English and MIL (O) or Alt. English or Hindi or Telugu. The optional subjects offered in the Arts stream are Anthropology, Economics, Political Science, History, Sanskrit, Philosophy and Education.
The optionals offered in the Science stream are Physics, Chemistry, Mathematics, Biology, Electronics and Geology. The combinations offered in these subjects are PCM with Biology or Electronics or Geology as fourth optional and PCB with Mathematics or Electronics or Geology as fourth optional. In the Commerce stream, the Business Organisation, Office Management, Costing, Financial Accounting and Business Mathematics are the primary optionals offered. There is no choice in this matter. All the five are to be studied. This apart one is to choose between Economics or Salesmanship as fourth optional.
![]()
7.2 Graphs
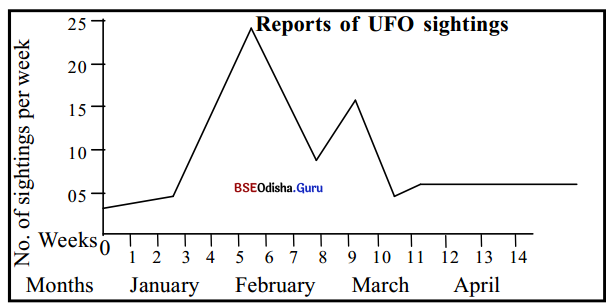
In America, there are frequent reports about Unidentified Flying Objects (UFOs) which people claim to have seen flying in the sky and which are believed to be space-ships carrying visitors from other planets. The following is a graph showing the number of UFOs “sighted” (seen) during a particular year. Study the graph.
Graphs
(I). Hints :
(a) 16 Jan, a science fiction film shown on the TV.
(b) 30 Jan, an article was published by an Airforce officer, interpreting UFOs as the result of aircraft movements.
(c) 16 Feb, a science correspondent attacked the Airforce officer’s findings.
(d) 26 Feb, a public debate between the Airforce officer and the science correspondent arranged, but the latter didn’t show up.
(II). Now, here are some questions you need to answer if you have to write a report (in words), based on the diagram above.
(a) There was a sharp rise in the number of reported sightings of UFOs. When ? Why ?
(b) After the rise, there was a marked fall in the number of reported sightings. When ? Why ?
(c) There was another rise, following the fall. Why ?
(d) What brought about the final fall ?
(e) Was there any noticeable rise in reports after the debate ?
Answer:
(a) There was a sharp rise in the number of reported sightings of UFOs. As per the reports, the rise recorded more than twenty during the early part of January and February. An article was published on the sightings of UFOs, as a result of the less movement of aircraft in the air.
(b) After a rise, there was a marked fall in the number of reported sightings towards the early part of March. It was perhaps due to the frequent movement of aircraft in the air.
(c) There was another rise, though small in quantity following the fall, due to fewer movements of civil and military aircraft.
(d) The increased movement of civil and military aircraft brought about the final fall.
(e) No, there was no noticeable rise after the debate.
![]()
Activity -4
Now complete the report below by filling in the blank.
During the early part of _________ this year the rate of UFO sightings was steady at around _________ or _________ a week. On 16 __________ a science fiction film about visitors from outer space was screened on television and immediately after that there was a sharp increase in reported sightings. On 30 __________ an Airforce officer, who had been investigating all such reports made his findings known. He maintained that all UFO reports could be explained quite naturally as being due to civil and military aircraft movements. Following this explanation, there was a rapid ___________ in the number of reported sightings. But the rate did not return to the pre-broadcast level. Some people, however, were not convinced. On 16 ____________, a science correspondent published a highly critical article about the findings of the Airforce officer. He demanded an independent inquiry. This article caused a renewal of interest in the subject of ___________ and a corresponding steep ____________ in the number of sightings. The rise, however, was not as marked as the increase in January. The Airforce officer invited the science correspondent to meet him in a public debate ____________ days later. But the science correspondent did not show up on the appointed day. The Airforce officer, in turn, produced some very convincing evidence for his case. As a result, interest in UFOs ___________ and the sightings were even fewer than at the beginning of the year. As the weeks went by there was a little increase in the number of reports.
Answer:
January, three, four, January, January, rise, February, UFOs, rise, ten, decreased
Activity – 5
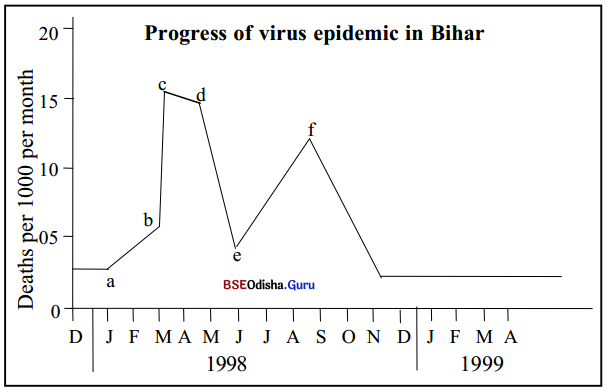
Have a close look at the graph below and write a report to accompany it.
Hints
a. Return of a group of migrant workers from an affected area.
b. Very dry summer, lack of drinking water.
c. Preventive measures introduced by the government.
d. WHO sends limited supplies of medicine.
e. Medicine loses effectiveness; virus develops resistance.
f. Vaccine produced; population vaccinated.
Answer:
Progress of Virus Epidemic in Bihar – A viral epidemic started in Bihar in December 1997. By February 1998 about 4000 people had died. It was then that a group of migrant workers returned from an affected area. This resulted in a sudden rise in the death toll. By the middle of March, the death toll stood at 7000 (approx.). This phenomenally escalated because of a very dry summer and lack of drinking water. Consequently, between the middle of March and April, the death toll rose to an all-time high of 18,000. Only then did the government wake up to introduce preventive measures. This saw a slight decrease in the death toll.
But towards the end of May when the WHO sent supplies of medicine, happily the death toll sharply decreased and by the middle of June, it had reduced to 5000. The decreasing trend, however, did not last long. The medicine soon lost its effectiveness as the virus developed resistance to the medicine and therefore once again the epidemic spread. As a result of this between mid-June and mid-September, almost 14,000 people died. By then a vaccine had been produced and the entire population was vaccinated. This proved effective and the death toll fell to 2000 by December 1998. By April 1999 the epidemic had been completely controlled.
![]()
Activity – 6
Write an account of a difficult night journey you made on a scooter from Sambalpur to Keonjhar. You may use the information in the diagram below.
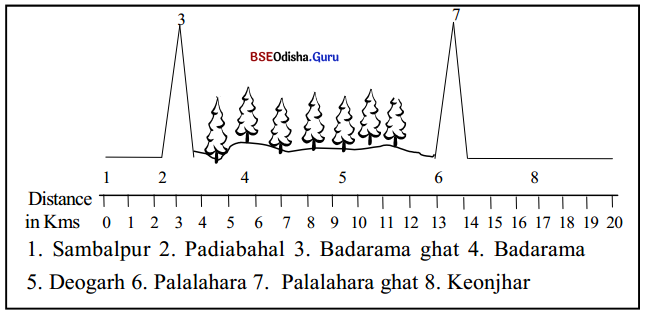
Hints: Carefully mark the mountains and forests shown in the graph.
Answer:
Night Journey by Scooter from Sambalpur to Keonjhar I began my journey by scooter from Sambalpur at 10.00 pm in night. It was going to be a long and arduous journey. By 10.30 p.m. I had reached Padiabahal. The road was good and there was not much of traffic. Ten minutes after that I arrived at Badarama ghat. All around there was. pitch darkness. I had to slow down as I crossed this dangerous ghat. There were steep curves and hairpin bends.
Negotiating them was nerve-racking. It took me almost 25 minutes to cross the 5 km-long ghats. After crossing the ghat, I arrived at Balarama. It was almost 11.30 p.m. then. I decided to stop at a roadside Dhaba for tea. I was already feeling drowsy. The tea did me good as I started off at midnight steeling myself for the long journey through the thickly forested areas of the Deogarh and Palalahara districts. The roads were undulating and had plenty of pot-holes and whenever an occasional truck passed by I had to drive slow and was pushed to the edge of the road.
All this slowed me down during this 70 km-long journey between Badarama and Palalahara. At 1.30 a.m. I passed Deogarh. In spite of the bad roads, I covered it in one and a half hours. After passing Deogarh, I felt as if I had crossed a big milestone. The forest area was gradually coming to an end. Yet it took me an hour to reach Palalahara. At Palalahara, I had another cup of tea. It was really refreshing. I washed my face, eased myself, and started on again. After 5 km I reached the Plalahara ghat.
This was not as steep and rough as the Badarama ghat. But I was careful as I negotiated its bends. It took me just 20 minutes to cross the ghat. This time I arrived at the level road leading to Keonjhar. The milestone read 35 km. The road was good. It had been repaired a few months back by the L and T Company. I sped in the darkness of the night. As it was nearing dawn, traffic was extremely thin. By 4.40 a.m. Sodium Vapour lamps greeted me as I entered Keonjhar and my journey came to an end.
![]()
Activity – 7
The students of your college are dissatisfied about a number of things and sometimes resort to strikes, Dharana, etc.
Write a report on the different incidents of student unrest during recent years in your college and how a satisfactory solution was found. First, prepare a graph and then write the report.
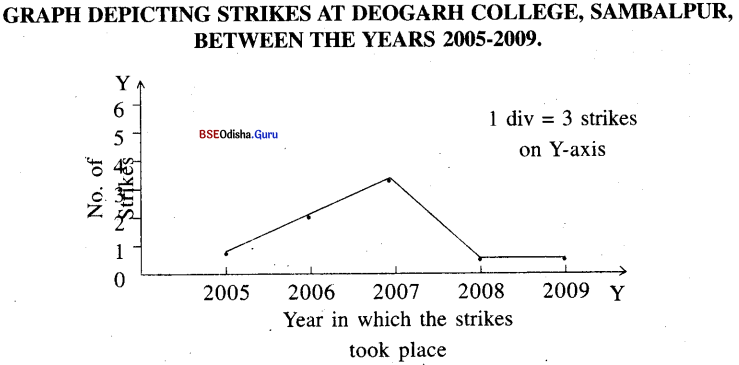
Report on strikes during the years 2005-2009 at Rampur College
Deogarh college in Sambalpur was established in 1999. It provides education at the +2 level in the Arts, Science and Commerce streams. Since its inception, the college was incident free till the year 2004. But when college elections were held in 2005 for the first time, strikes were witnessed in the college. In 2005, one of the presidential candidates who lost by a very narrow margin went on a hunger strike. He had lost by 11 votes and therefore he requested for recounting. The panel of Appeals only assented to readdition.
He agreed but after readdition when the result was the same, he went on dharma for a second time, sitting under the portico and prohibiting everyone from entering the college. No one paid any attention to him for 4 days but suddenly on- the fifth day he feigned unconsciousness. As a result, the panel of Appeals allowed the counting of votes in Ballot papers. Once again he was proved wrong and the college limped back to normalcy. After 2005, strikes became a regular feature.
In 2006, 6 incidents of striking and unrest during the whole academic year. The strikes were resorted to for several reasons like, such demand for a bus stop in front of the college, postponement of Examinations etc. In 2007, the spate of students unrest shot up to 12 separate incidents of dharnas and strikes because of the sudden increase in the tuition fees and corruption in the admission of students. This was perhaps the worst year of student unrest and all that was only settled with the intervention of the collector and the dismissal of a few clerks.
After this, an aura of fear was seven among the students as well as the staff. Besides this, the government appointed Dr R. K. Sahu a man of great integrity as the principal of the college. As a result strikes completely stopped in the college. The year 2009 was also a year of no strikes and the college witnessed a new spirit of amity among the staff and the students. Thus the graph shows that strikes reached their peak in the year 2007 and had their complete decline in the year 2009.
![]()
7.3 Charts
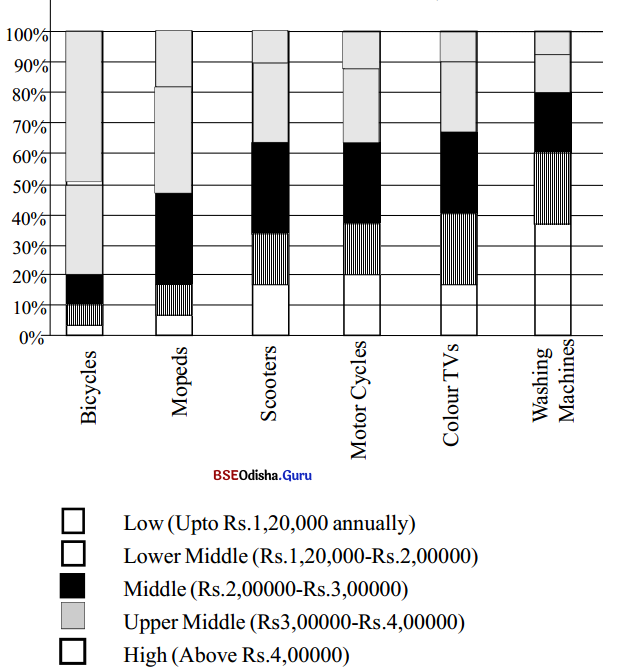
Look at the chart below. It shows the ownership pattern of durable goods by different families in India. Try to understand the facts presented in it and answer the questions that follow :
Ownership pattern of Durables (Percentage of the total owned by different income classes)
Now answer these questions :
a. What is the annual family income of the people belonging to the low category?
b. What percentage of which goods do they buy as shown in the chart?
c. Considering their limited income, do they buy a lot?
d. Would you call the people belonging to the high category “rich”? Do they spend enough on consumer durables, in proportion to their income? What percentage of goods do they buy? What do the rich prefer to buy?
Question (a)
What is the annual family income of the people belonging to the low category?
Answer:
The annual family income of people belonging to the low category is Rs 1,20,000.
Question (b)
What percentage of which goods do they buy as shown in the chart?
Answer:
The percentage of goods which the low category people buy is as follows: Bicycles – 47% Mopeds – 17% Scooters – 9% Motorcycles – 11% Colour TVs – 10% and Washing Machines – 6% Note – All are approximate figures.
Question (c)
Considering their limited income, do they buy a lot?
Answer:
Yes, in spite of earning Rs 1.20,000 annually, they hold 17 percent of the market share in durables which is equal to the market share of the higher-income group and more than the market share of the upper-middle group.
Question (d)
Would you call the people belonging to the high category “rich”? Do you spend enough on consumer durables, in proportion to your income? What percentage of goods do they buy? What do the rich prefer to buy?
Answer:
In comparison with the low-income group, the people of the high-income group are definitely richer but their market share is comparatively lower than the market share of the low-income group in proportion to their income. They buy only 3 percent Of bicycles, 7 percent of mopeds, 17 percent of scooters, 20 percent of motorcycles, 19 percent of color T.V.s, and 37 percent of washing machines. It is obvious that they prefer to buy goods like color T.V.s and washing machines.
![]()
Activity – 8
Fill in the blanks in the report below with the ideas from the chart above.
A short report on the Ownership pattern of consumer durables in India.
The poor in India do not have a lot of money: their annual family income, on average, comes to Rs. 20,000. But they make a lot of purchases and constitute the mainstay for most products in the country. For example, families belonging to this category own _____________ of all bicycles, __________of mopeds, __________ of scooters, ___________ of motorcycles, and 10 percent of color televisions. They even own washing machines. The rich, in contrast, have money, but their share of purchases of these products is comparatively much less. Despite the money they have, they buy only ___________ of bicycles ___________ of mopeds, ___________of scooters, ___________ of motorcycles, and _____________ of color TVs. The poor earn less but spend more. And the rich earn more but spend less.
Answer:
The poor in India do not have a lot of money: their annual family income, on average, comes to Rs. 20,000. But they make a lot of purchases and constitute the mainstay for most products in the country. For example, families belonging to this category own 47 percent of all bicycles, 17 percent of mopeds, 9 percent of scooters, 11 percent of motorcycles, and 10 percent of color televisions. They even own washing machines. The rich, in contrast, have money, but their share of purchases of these products is comparatively much less. Despite the money they have, they buy only 3 percent of bicycles, 7 percent of mopeds, 17 percent of scooters, 20 percent of motorcycles, and 19 percent of color TVs. The poor earn less but spend more. And the rich earn more but spend less.
Activity – 9
Look at the chart below and answer the questions that follow.
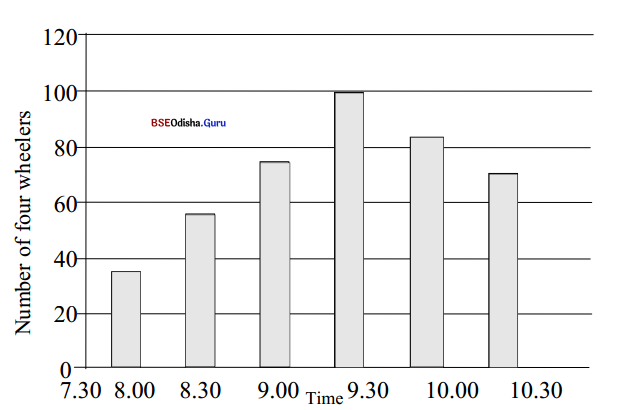
Four-wheelers that passed over the bridge :
Question 1.
When was the bridge least busy?
Answer:
The bridge was least busy between 7.30 and 8.30 a.m.
Question 2.
When did the rush hour begin? When was the bridge most busy?
Answer:
The rush hour began at 9.00 a.m. and continued till 10.00 a.m. The bridge was most busy at 9.30 a.m.
Question 3.
How many vehicles in total passed over the bridge by 10.30?
Answer:
A total of 420 (approx.) vehicles passed over the bridge by 10.30.
Question 4.
If you know that schools start at 9.30 and government offices at 10.00, can you think of a way to reduce the pressure of traffic between 9.00 and 10.00?
Answer:
The school timings can be changed from 9.30 to 8.00 to reduce the pressure of traffic.
![]()
Activity – 10
Use the information in the chart below and write a short report to show which course was popular and why. (No reason has been shown in the chart, you have to think of some).
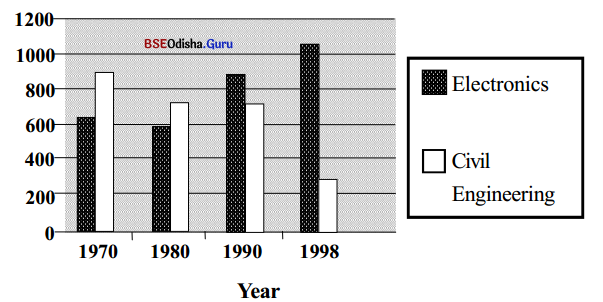
(Students enrolled in the Civil Engineering and Electronics courses of an Engineering College.)
A short report on the popularity of Civil Engineering and Electronics courses between 1970 -1998.
Answer:
In the year 1970 students’ preference for Civil Engineering was very high. 900 students were admitted for Civil Engineering courses whereas only 610 had enrolled for Electronics. Civil Engineering was a traditionally demanded subject and with a lot of development works taking place then, jobs were aplenty. On the other hand, electronics had been newly introduced and did not have many employment opportunities.
Ten years later Civil Engineering was still popular but because of a slight decrease in employment opportunities student enrolment also saw a slight decrease. Enrolment in Electronics however did not register much change. By 1990, the introduction of computers all over India, boosted the popularity of electronics and as it provided better job opportunities there was an increase in student enrolment in courses on Electronics. Now 900 students have been enrolled in Electronics while only 700 are in Civil Engineering.
The popularity of Electronics soared to new heights with the entry of multinationals into India after 1995. The multinationals provide great job opportunities and with many job opportunities overseas for computer professionals with handsome pay packets, the Electronics courses witnessed an admission of more than a thousand students in 1998. By then jobs for Engineering students were completely saturated. Civil engineers remained unemployed and therefore. Civil Engineering courses were no more popular. In 1998 only 300 students got enrolled in Civil Engineering.
7.4 Tables
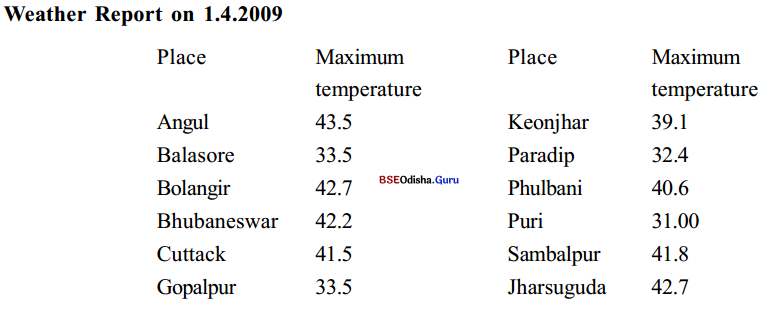
Look at the table below, showing the maximum temperature recorded at different places in Odisha.
II. Answer these questions.
Question (a)
What was the highest temperature recorded?
Answer:
The highest record temperature was 43.5.
Question (b)
Where was it recorded?
Answer:
It was recorded at Angul.
Question (c)
Which were the other places that recorded high temperatures?
Answer:
The other places which recorded high temperatures were Bhubaneswar, Bolangir, Cuttack, Phulbani, Sambalpur, and Jharsuguda.
Question (d)
What was the maximum temperature in Bhubaneswar?
Answer:
The maximum temperature in Bhubaneswar was 42.2.
Question (e)
Which other places were as warm as Bhubaneswar?
Answer:
Bolangir, Jharsuguda, Sambalpur and Cuttack were as warm as Bhubaneswar.
Question (f)
What was the weather like in Puri, Gopalpur, Paradip, and Balasore? Why?
Answer:
The weather in these places was considerably less warm. It stood between 32.00 to 33.5. This is because these towns are on the coast.
![]()
Activity-11
Fill in the blanks to complete the following report based on the table above.
A report on today’s weather in Odisha
It was the season’s hottest day, in Odisha today. The temperature in many places went beyond __________ Celsius. Of all places in Odisha, _________recorded the highest temperature of __________ The other places that experienced an equally hot day were Bolangir and Jharsuguda. In these two places, the mercury soared up to __________ Bhubaneswar, the capital city, recorded a high temperature of __________ The other places that were as hot as Bhubaneswar were ________ and __________ with a recording of __________ and ___________ respectively. However, ____________, __________, Paradip, and Balasore, places near the sea, were relatively cooler. They recorded maximum temperatures of around ___________ Celsius.
Answer:
A report on today’s weather in Odisha
It was the season’s hottest day, in Odisha. The temperature in many places went beyond 40° Celsius. Of all places in Odisha, Angul recorded the highest temperature of 43.5° Celsius. The other places that experienced an equally hot day were Bolangir and Jharsuguda. In these two places, the mercury soared up to 42.7° Celsius. Bhubaneswar, the capital city, recorded a high temperature of 42.2° Celsius. The other places that were as hot as Bhubaneswar were Cuttack and Sambalpur with a recording of 41.5° Celsius and 41.8° Celsius respectively. However, Gopalpur, Puri. Paradip and Balasore, places near the sea, were relatively cooler. They recorded maximum temperatures of around 33.5° Celsius.
Activity – 12
The following table presents a weather report on the basis of data recorded up to 8.30 a.m. on Friday, 8 December. Have a look at the table and answer the questions that follow. Then write a short report to go with the table.
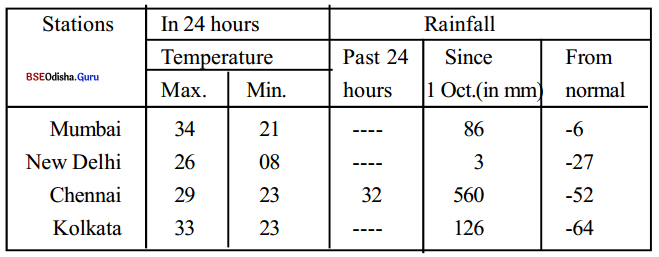
(a) On 8 December, Mumbai had the highest maximum temperature.
Question (i)
Which City had the lowest maximum temperature?
Answer:
Delhi had the lowest maximum temperature on 8 December.
Question (ii)
What was the temperature?
Answer:
The temperature was 20° C.
(b). Question (i)
Which city had the highest minimum temperature?
Answer:
Chennai had the highest minimum temperature.
Question (ii)
How much was it?
Answer:
The temperature was 23°C.
Question (c)
Which city had rainfall during the past 24 hours?
Answer:
Chennai had rainfall during the past 24 hours.
Question (d)
Which city had recorded the highest amount of rainfall since 1 October?
Answer:
Chennai had recorded the highest amount of rainfall since 1 October.
![]()
Weather report of Metro Cities:
Even in winter, the Metro cities of India were quite warm. On 8 December, Mumbai was the hottest with a maximum temperature of 34° celsius, while the lowest maximum temperature, 26° celsius, was recorded at Delhi. The same day, New Delhi, recorded the lowest minimum temperature of 08° celsius. It was quite cold there but in spite of recording maximum temperatures of 29° and 33° Celsius, the lowest minimum temperatures at Chennai and Kolkata respectively remained constant at 23° Celsius.
Similarly, Chennai witnessed the highest amount of rainfall in a week since 1 Oct. The rainfall stood at 560 inches which was 52 inches less than normal. New Delhi recorded the least rainfall during the week. It was only 3 inches which were 27 inches less than normal. Mumbai and Kolkata too had 6 inches and 64 inches respectively, less rainfall than normal. On the whole, rainfall in all the Metro cities was less than normal.
Activity -13
Here is a table of figures showing the leisure habits of the people of Bhubaneswar.
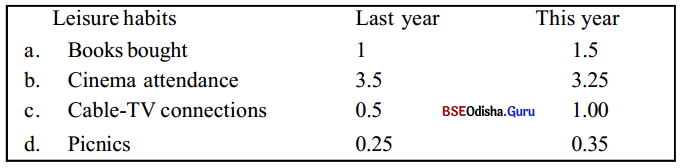
Use the information given in the table above and write a short report.
The leisure habits of the people of Bhubaneswar in the last year and this year does not show significant change. Last year, 1 lakh books were bought by people and this increased to 1.5 lahks this year. Thus there was an increase of 50% in the sale of books. There was a similar rise in Cable – T.V. connections. While, last year, only 50,000 people subscribed to Cable.
T.V., this year, the subscribers had increased to 1 lakh which is a 50 percent increase. As a result of this cinema, attendance fell from 3.5 lahks to 3.25 lakh last year to this year. Happily however 10,000 more people went on picnics this year than last year. However, in comparison with leisure activities like reading books or watching Cable T.V. going on picnics is the least popular.
Activity -14
Look at the table below and write a paragraph based on the information given in it.
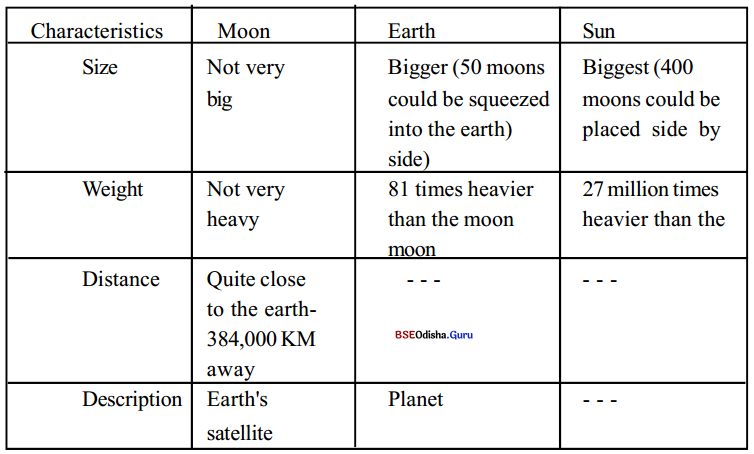
Answer:
A comparative study of the Moon, the Earth, and the Sun:
Among all the bodies in the solar system, the Moon, the Earth, and Sun are the most significant. But they differ in size, weight, distance, and description. The Moon is the smallest of heavenly bodies while the Earth is 50 times bigger than the Moon and the Sun 400 times bigger than the weight of Moon is also the least while the Earth and the Sun are 81 times and 27 million times more than the Moon. If Earth is taken as a center point, the distance of the Moon from the Earth is 384,000 km. In fine, the Moon is a satellite of the planet Earth.
![]()
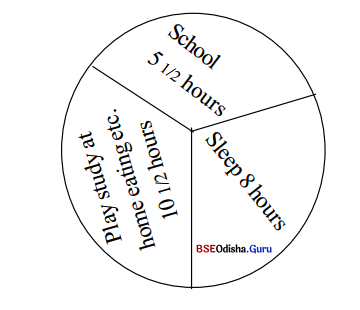
7.5 Pie Charts/circle charts
Here is a chart showing how Ramesh spends his day, Look at the chart and answer the questions that follow.
Activity- 15
(i)Answer the following questions.
a. How many hours does Ramesh spend at school?
b. Does this include the time he spends on the way to and from school?
c. How long does he sleep? When do you think he goes to bed? When does he get up?
d. How much time does he spend on the play?
e. How much time does he spend on his studies at home?
f. Do you divide your time in the same way?
Answer:
(a) Ramesh spends five and a half (51/2) hours at school.
(b) Yes, the hours spent at school include the time on the way to and from school.
(c) He sleeps for eight (8) hours a day He is supposed to go to bed at 10 p.m. and gets up at 6 a.m.
(d) It is supposed that Ramesh spends about 61/2 hours in playing.
(e) He spends about 6V2 hours on his studies.
(f) Yes, I divide time in the same way.
(ii) Now complete the report below by filling in the blank spaces with ideas from the pie chart above.
(iii) A child’s daily routine.
Ramesh walks to school at 10. It takes him hardly 20 minutes to get there. After prayers, he attends classes from 10.30 to 4 p.m. which includes a tiffin break for half an hour, from 1 to 1.30. At 4, when the classes are over, he comes back home, with his friends. He greatly enjoys the return trip home as his friends and he usually amuses themselves with innocent jokes, makes fun, and indulges in different kinds of innocuous mischief. On reaching home, he gobbles up something and scampers away to join his friends either in volleyball or in some country games, which he plays for just one hour. At 6, he has a wash, says his prayers, and sits down to study from 6.30 to 9.30 in the evening. At 9.30 he has dinner, does some light reading, and goes to bed by 10.30 p.m. The next morning he is up by 6.30. Within one hour he brushes his teeth have a wash, etc. and by 7.30 he is at his study table. He does his homework for two hours. At 9.30 he has an early lunch, packs his books in the bag, and is ready to go to school.
![]()
Activity – 16
A. Look at the chart below. It tells us how Mrs. Pattnaik spends her money.
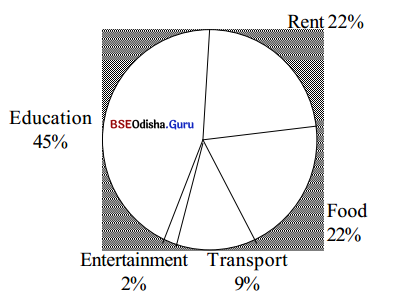
Does Mrs. Pattnaik spend her money wisely? Why do you think so?
Answer:
Mrs. Pattnaik receives net cash of Rs 6000/- from her husband. She spends Rs 2700/- that is 45% of it towards her children’s education. She sends Rs 1350/- each to her son, who is studying engineering, and daughter who is studying medicine. Besides this, she spends equally on her house rent and food. For a three-room apartment, she pays Rs 1320/ which is 22% of the money she receives. She spends the same amount on food for a month. In addition to all this, she spends 540/- on transport.
Of this, she gives Rs 300A to her husband for petrol and monthly maintenance of his scooter and uses the rest for transport needs. She spends the least on entertainment spending Rs 80/- for her cable T.V. connection and Rs 40/ – for an occasional picture along with her husband. In all this, she spends her money wisely investing largely in her children’s education.
B. Look at the following diagram :
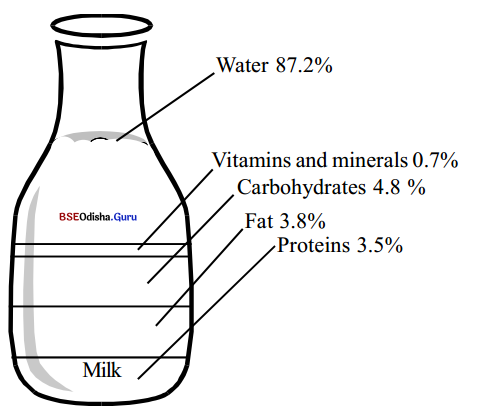
Now write a few sentences explaining why milk is considered to be a well-balanced food.
Answer:
Milk is considered a well-balanced diet because it has proteins, fats, carbohydrates, vitamins, and minerals as well as water in the right proportions and as required by the body. Moreover, milk is a universal diet that is available everywhere. It can also be taken by people of all ages.
C. You have collected the opinions of 500 people through a random sample survey. The findings of the survey are presented in the chart below.
Now use the information in the chart
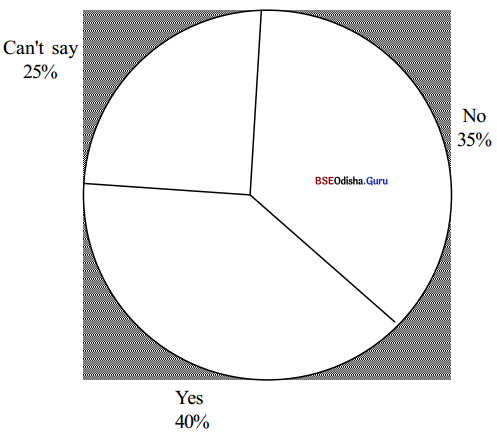
The subjects were asked whether India should adopt the presidential form of government.
Answer:
A random sample survey of 500 people in Metro cities was conducted by the Operations Research Group to find the people’s opinion on changing over to a Presidential form of Government. The respondents were chosen from a cross-section of society. The results of the survey reveal that the majority were in favor of a Presidential form of Government.
However, they only consist of 40% of the respondents. 35 percent of the respondents are against a Presidential form of Government while 25 percent opined that they could not say anything about it. Thus though the majority calls for a Presidential form of Government, it is only a small majority as far as the percentage of respondents is concerned.
![]()
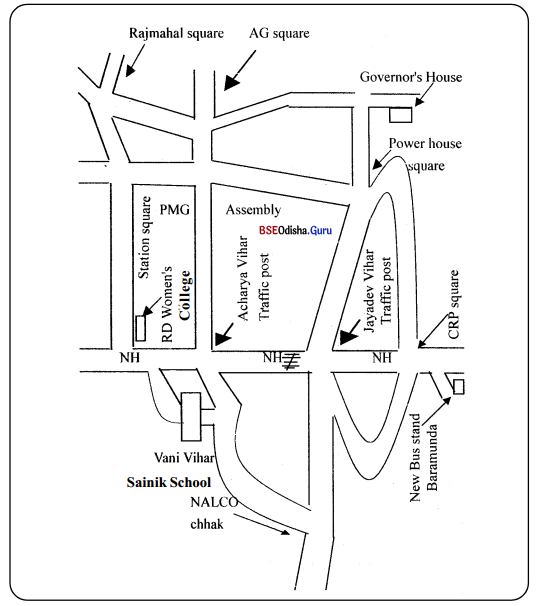
7.6. Maps
You are traveling by bus to Bhubaneswar. After reaching the new bus stand at Baramunda, you hire an auto-rickshaw to take you to Vani Vihar for an interview. But the highway is blocked at a point between Jayadev Vihar and Acharya Vihar. The auto-driver tells you he is new to Bhubaneswar and does not know all the roads. Which route would you ask him to take? Use the map below to decide on a route to Vani Vihar and then write down the instructions you would give the driver.
A. Answer the following questions.
Question 1.
How many possible routes are available to you?
Answer:
There are three routes available to go to Vanivihar.
Question 2.
Which route would you prefer?
(i) CRP square – Power house square – Assembly and Station square – R.D. Women’s College.
(ii) CRP square – Jayadev Vihar – Power house – Assembly – Acharva Vihar.
(iii) CRP square – Jayadev Vihar – Nalco Chhak – Vani Vihar.
Answer:
I would prefer the CRP square – Jayadav Vihar – Nalco Chhak – Vani Vihar route.
Question 3.
Would you take the CRP – Power house – Jayadev Vihar Acharya Vihar traffic route? If not, why?
Answer:
It would not be of any use to take this route because the traffic is blocked between Jayadev Vihar and Acharya Vihar. Another man, under similar circumstances, chose the route Jayadev Vihar – NALCO Chhak – Vani Vihar and gave the following instructions. Read the instructions before you write your own instructions.
B. instructions were given to the auto driver.
Go straight along the National Highway up to _________. Then turn left and take the Nandankanan Road. Keep going for about two kilometers and then turn right at ___________. Continue until you come to the ___________ on the left. Don’t stop. Go straight ahead. YOU will reach Vani Vihar after half a kilometer. You can see the gates of Vani Vihar on the left, just 1(X) meters before the Acharya Vihar traHie post. Enter and go straight to the Administrative Block.
![]()
Activity – 17
Fill in the blanks in the paragraph above with ideas from the map above.
Some common expressions used in giving instructions to reach someplace.
Turn right / left. Go straight ahead. Pass two roads on the right / left. On your left, you will see ……………. etc.
Go straight along the National Highway up to Javadev Vihar. Then turn left and take the Nandankanan Road. Keep going for about two kilometers and then turn right at Nalco Chhak. Continue until you come to the Sainik School, on the left. Don’t stop. Go straight ahead. You will reach Vani Vihar after half a kilometer. You can see the gates of Vani Vihar on the left, just 100 meters before the Acharya Vihar traffic post. Enter and go straight to the Administrative Block.
Activity – 18
Look at the map of a town given below. A car and a bus have collided on Bridge Road, causing a road block. Another car (shown on the map) has to reach the railway office. Write down the instructions that you would give the driver of the car.
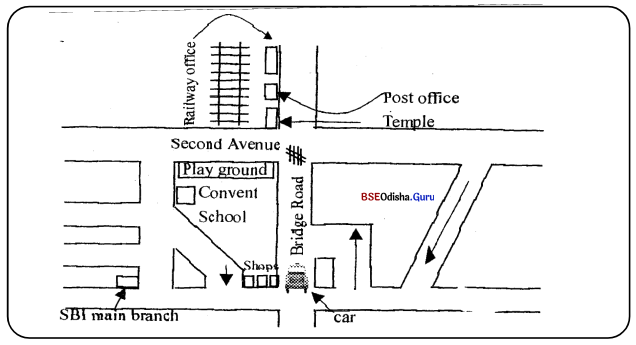
Answer:
Turn right towards the shops and then go along the boundary of the Convent School again on the right till you reach Second Avenue. Here take a turn to the right till you reach the temple which you can see on the left. Here take a turn to the left and drive on till you cross the temple and the post office. The third building on this street is the Railway Office.
Activity – 19
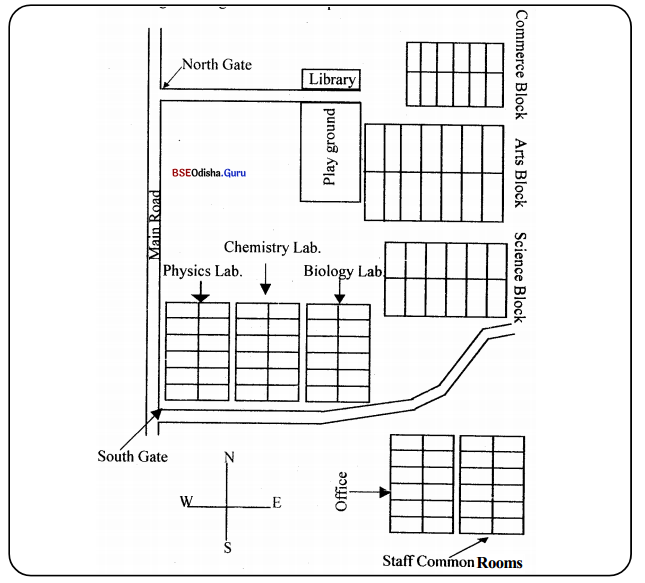
The following is a map of your college. Write a letter to a friend, describing the things shown on the map.
Bhubaneswar
15.04.2012
Dear Gautam,
How are you? It is a long time since 1 wrote to you. In your last letter, you asked me to describe my college. Now that I am completely familiar with my college 1 can very vividly describe it. Our college faces the west and its front boundary runs along the main road. It has two gates that open onto the main road, one at the north end and another at the south end. The north gate leads to the library and the playground right in front of it. Beyond the library is the Commerce Block.
It is the smallest Block. Beside it on the south side is the Arts Block which constitutes the biggest building of the college. Further south, down the Arts Block, is the Science Block, it is bigger than the Commerce Block but smaller than the Arts Block. The Commerce and Science Blocks have twelve rooms and galleries each but the rooms and galleries of the Science Block are bigger than that of the Commerce Block.
The Arts Block has even huger rooms and galleries numbering fourteen in all. Near the Science Block towards the southwest are the Physics, Chemistry, and Biology laboratories. The entrance to the laboratories is in the north. They face the road leading to the Library from the north gate. The Biology Lab. is the closest from the Science Block. After the Biology Lab is the Chemistry Lab and then the Physics Lab which borders the main road. The back of these Laboratories runs along the road leading from the south gate to the Science Block.
Beyond this road on the south, are the office and staff common rooms. They lie adjacent to each other. Of course, the entrance to the office is from the West while the entrance to the staff rooms is on the south. All the Blocks, Laboratories, staff rooms, and office buildings are rectangular in structure. I hope, 1 have given a clear picture of the layout of my college. 1 am sending a photocopy of a map which found in the college calendar to make things more clear.
Do write to me,
Love,
Sanjay
![]()
Activity – 20
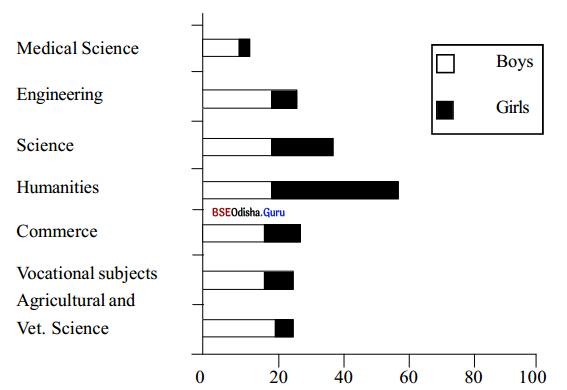
Use the information in the chart below and write a report stating which courses are popular in Odisha, which courses are popular among women, what percentage of boys and girls get enrolled in each course, etc.
Students taking admission in different branches of study in Odisha.
Students’ Enrolment and popularity of courses in Odisha.
Answer:
In Odisha, courses in the humanities stream are the most popular. Almost sixty students of every 100 opt for humanities. In addition, the largest number of girls enroll in humanities courses where the proportion between girls and boys is 60: 40. Courses in science stand second in popularity. In such courses the proportion between boys and girls is 50: 50.
Engineering courses take third place in popularity. This course is more popular with boys than with girls. Hence the enrolment of boys to girls in this course is 70: 30. Commerce courses are next in terms of popularity. This course is preferred more by boys than by girls. The proportion between boys and girls in this course is 80: 20. Agriculture, Forestry and Vet Science stand next in popularity. Here too the boys dominate over girls with a proportion of 80: 20. After this, vocational subjects are preferred.
In this course there are more boys than girls with the proportion being 75: 25. Finally, the Medical science course is the least popular. This course too has more boys than girls and the proportion between them is 90: 10. On the whole, while humanities and science courses are the most popular, the Medical science course is the least popular. Moreover, while more girls are enrolled in humanities, the proportion of boys in all other courses is larger than that of girls.
Activity – 21
The graphs below represent the spending habit of the young and old people of Odisha. Compare the information in both graphs and write a paragraph.
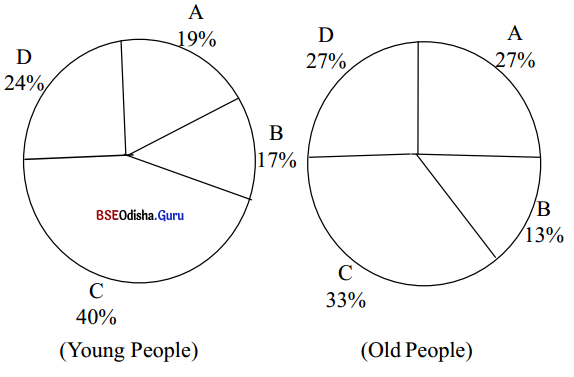
A – Housing, fuel, light, and power
B – Clothing, footwear, and durable goods
C – Other goods and services
D – Food
Comparative spending habits of the young and old in Odisha.
Answer:
A comparative study of the spending habits of the young and old people of Odisha reveals that both groups spend the most on other goods and services which exclude food, shelter, and clothing. While young people spend 40% of their income on other goods and services, old people spend 33% on this. Items that constitute other goods and services include household items like Refrigerators, Washing Machines.
Air Coolers, Grinders, and the like. Services in this category mainly consist of transport and entertainment. Similarly, both groups spend the least on clothing, footwear, and durable goods. However, young people spend more than old people on this item. The former spend 17% of their income while the latter spend 4% less that is, 13% of their income on clothing, footwear, and durable goods. The old people spend equally on housing and food. They give more priority to these items on their budget than the young.
54% of their income, that is 27% is spent each on food and housing. The young people, on the other hand, spend 24% and 19% respectively on food and housing. They give more priority to food than to housing. However, the amount they spend on each of these items is less than what the old spend on it. In short, the young and the old give top priority to other goods and services while giving the least priority to clothing, footwear, and other durable goods. But the old people give more priority to food and housing than the young.
![]()
Activity – 22
Prepare a newspaper report on the basis of the information presented in the graph below.
Answer:
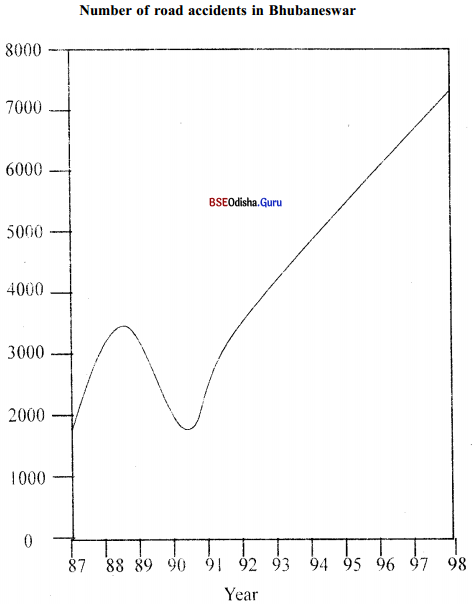
Alarming rise in Road Accidents
By our correspondent :
Bhubaneswar, Aug 18: There has been an alarming rise in road accidents in Bhubaneswar since 1991. Talking to our correspondent, Mr. Sudhansu Mohanty. the traffic SP. Bhubaneswar pointed out that since the last decade, road accidents have occurred in Bhubaneswar with alarming frequency. Quoting statistics available in his department he is reported to have said that between 1987 to the middle of 1988 almost 3500 people were reported to have died due to road accidents. The sudden spurt in accidents and the number of fatalities forced the government to enforce traffic laws especially, the donning of helmets.
As a result deaths due to accidents decreased gradually and touched a low of 1700 in mid ’90. However, changes in the Government and relaxation of traffic rules after this saw a dramatic rise in fatalities caused by road accidents. Thus, in ’92 the number of fatalities rose to 3600, in ’94 to 4800, and in ‘98 to 7200. Thus from the middle of 1990 to the end of 1998, almost 5400 people died as a result of road accidents in Bhubaneswar. It is hoped that law enforcement agencies will take steps to enforce laws and traffic rules, NGOs will educate people on traffic rules and the public will cooperate to ensure that the roads of Bhubaneswar are safe for one and all.
![]()
Activity – 23
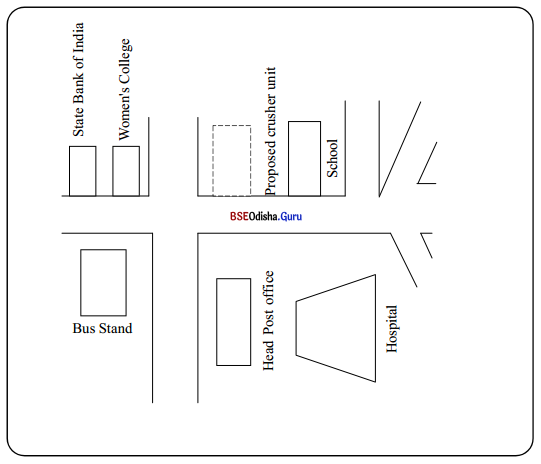
An influential person has applied for permission to set up a stone crusher unit at a place indicated with dots on the map below. As a resident of the area, you have serious objections. Write a letter to the appropriate authority expressing your objections.
Answer:
80 Saheed Nagar, Bhubaneswar
17 April 2012
The Collector and District Magistrate
Collectorate
Puri Road, Bhubaneswar
Dt. Khurda
Sir,
I wish to invite your attention to a stone-crusher unit that is proposed to be set up in the center of the city.
As you may be aware that there are two acres of government land right in front of the Head Post Office beside the Convent School on Janpath road, Bhubaneswar. This piece of land is being reportedly leased to an extremely influential person to set up a stone crusher unit. Such a step is highly objectionable.
First of all, the Honourable High Court of Odisha had in an already judged P.I.L. petition stated that no stone-crushers unit should be set up within 20 km of the city limits. Consequently, stone-crusher units beyond Khandagiri have now moved beyond Khurda. Therefore building a unit here is entirely illegal. Secondly, stone-crusher units cause great environmental pollution and bring with it numerous health hazards.
The stone-crusher units spread a pall of dust which is especially dangerous for people with respiratory problems like Asthma. Thirdly, the stone crusher unit is being proposed in an area that is heavily populated, though you may call it a floating population. It is situated right in the middle of a school and a women’s college which is on either side of it. Thus, it will not only affect our young ones in the school but also the girls in the women’s college. The proposed unit can cause a lot of sound pollution besides dust pollution.
This is really unwelcome in an educational block of buildings. Finally, the land on which the proposed crusher unit is being proposed to be set up has a lot of evergreen trees and serves as an environmental cushion for the whole city. Cutting down trees to set up a stone-crusher unit on it is therefore the least desirable thing that could be done there. I request you to therefore prohibit the lease of the land for the proposed stone-crusher unit and instead develop it into a park in which all the members of the public are with you. Yours faithfully (Suman Priyadarshini)
Member-Secretary
Odisha Environmental Society.
Bhubaneswar