
Regular revision with Class 7 Maths MCQ with Answers and Ganita Prakash Class 7 Maths Part 2 Chapter 5 Connecting the Dots MCQ improves accuracy in objective exams.
MCQ on Connecting the Dots Class 7
Connecting the Dots MCQ Class 7
Class 7 Maths Connecting the Dots MCQ
Question 1.
The daily temperatures (in °C) for a week are 30, 27, 29, 35, 34, 32, 30. What is the mean temperature?
(a) 31°C
(b) 32°C
(c) 30°C
(d) 29.5°C
Solution:
(a) 31°C
Given, daily temperatures (in °C) for a week are: 30, 27, 29, 35, 34, 32, 30
We know, Mean = \(\frac{Sum of observations}{Number of observations}\)
∴ Mean temperature (in °C)
= \(\frac{30+27+29+35+34+32+30}{7}\)
= \(\frac{217}{7}\) = 31
Question 2.
The mean of the first 15 natural numbers is:
(a) 5
(b) 7.5
(c) 8
(d) 9.5
Solution:
(c) 8
Sum of first 15 natural numbers
= 1 + 2 + 3 + 4 + 5 + 6 + 7 + 8 + 9 +10 + 11 + 12 + 13 + 14 + 15 = 120
Mean of first 15 natural numbers
= \(\frac{Sum of first 15 natural numbers}{15}\)
= \(\frac{120}{15}\) = 8
Question 3.
The following dot plot shows the hours of sleep taken by a child on different days.
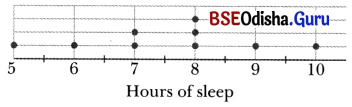
The range of the number of hours of sleep is:
(a) 4
(b) 8
(c) 5
(d) 10
Solution:
(c) 5
We know, range of data = Highest value – Lowest value
In the given dot plot, minimum hours
= 5 and maximum hours = 10
∴ Range = Maximum hours – Minimum hours 10 – 5 = 5

Question 4.
The table shows the number of flowers that bloom in a garden in 7 days.
| Day | Mon | Tue | Wed | Thu | Fri | Sat | Sun |
| No. of flowers | 5 | 4 | 6 | 7 | 3 | 5 | 2 |
What is the median number of flowers?
(a) 2
(b) 3
(c) 4
(d) 5
Solution:
(d) 5
Given, the number of flowers that bloom in garden for 7 days are: 5, 4, 6, 7, 3, 5, 2
Arranging the data in ascending order, we get: 2, 3, 4, 5, 5, 6, 7
Here, number of observations, n = 7, is odd.
∴ Median = \(\left(\frac{n+1}{2}\right)^{\text {th }}\) observation
= \(\left(\frac{7+1}{2}\right)^{\text {th }}\) observation = 4th observation
⇒ Median = 5
Question 5.
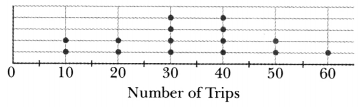
The difference between mean and median of the given dot plot showing number of trips taken by different families during an year, is:
(a) 0.33
(b) 3.33
(c) 0.0033
(d) None of these
Solution:
(b) 3.33
Writing down the data from the given dot plot, we get the values:
10, 10, 20, 20, 30, 30, 30, 30, 40, 40, 40, 40, 50, 50, 60
Total number of observations (n) =15 For mean,
Sum = (10 × 2) + (20 × 2) + (30 × 4) + (40 × 4) + (50 × 2) + (60 × 1)
= 20 + 40 + 120 + 160 + 100 + 60 = 500
Mean = \(\frac{500}{15}\) = 33.33
For median, (data is already in ascending order)
Since n = 15 is odd, median = \(\left(\frac{15+1}{2}\right)^{\text {th }}\) = 8th value of the data
The 8th value of the data is 30.
∴ Median = 30
Now, Difference = mean – median = 33.33 – 30 = 3.33]
Question 6.
Mean of 10 numbers is 20 and the mean of 5 numbers is 8. Then, the mean of all the 15 numbers is:
(a) 10
(b) 15
(c) 16
(d) 17
Solution:
(c) 16
Given, mean of 10 numbers = 20
∴ Sum of 10 numbers = Mean × 10
= 20 × 10 = 200
Also, mean of 5 numbers = 8
∴ Sum of 5 numbers = Mean × 5
= 8 × 5 = 40
Now, sum of all 15 numbers = Sum of 10 numbers + Sum of 5 numbers
= 200 + 40 = 240
∴ Mean of all 15 numbers
= \(\frac{Sum of 15 numbers}{15}\) = \(\frac{240}{15}\) = 16
Question 7.
If the median of \(\frac{x}{5}, x, \frac{x}{4}, \frac{x}{2} \text { and } \frac{x}{3}\) (where x > 0) is 8, then the value of x would be:
(a) 24
(b) 8
(c) 15
(d) 10
Solution:
(a) 24
Given, the observations are: \(\frac{x}{5}, x, \frac{x}{4}, \frac{x}{2}, \frac{x}{3}\)
To find the median, we first arrange-them in ascending order.
Since x > 0, the larger the denominator, the smaller the value.
Thus arranging the observations in ascending order, we get: \(\frac{x}{5}, \frac{x}{4}, \frac{x}{3}, \frac{x}{2}, x\)
Here, number of observations, n = 5, is odd.
∴ Median = \(\left(\frac{5+1}{2}\right)^{\text {th }}\) observation
= 3rd observation = \(\frac{x}{3}\)
According to the question,
Median = 8 ⇒ \(\frac{x}{3}\) = 8
⇒ r = 8 × 3 = 24
Question 8.
A cricket player scored 220 runs in 5 matches but did not bat in one of the innings. What is the mean score of the player?
(a) 36.67
(b) 38
(c) 55
(d) 45.67
Solution:
(c) 55
Given, the player scored 220 runs in 5 matches in total and did not bat in one inning.
∴ Mean = \(\frac{Total score}{Number of innings played}\)
= \(\frac{220}{4}\) = 55
Question 9.
The mean of five numbers is 18. If the number 32 is removed, what is the mean of the remaining four numbers?
(a) 12.5
(b) 14.5
(c) 13
(d) 16.5
Solution:
(b) 14.5
Given, mean of 5 numbers = 18
∴ Sum of 5 numbers = 5 × 18 = 90
As, number 32 is removed,
Sum of remaining 4 numbers = 90 – 32 = 58
∴ Mean of remaining four numbers
= \(\frac{58}{4}\) = 14.5
Question 10.
A data set contains 11 values arranged in ascending order. The 6th value is 42. Which of the following must be true?
(a) The mean is 42.
(b) The median is 42.
(c) All values are dose to 42.
(d) There is no outlier in the data.
Solution:
(b) The median is 42.
For an odd number of observations, the median is the middle value.
Here, the number of observations is 11 which is odd.
∴ Median = \(\left(\frac{11+1}{2}\right)^{\mathrm{th}}\) value = 6th value = 42
Question 11.
The median of prime numbers between 20 and 50 is:
(a) 31
(b) 37
(c) 41
(d) 43
Solution:
(b) 37
The prime numbers between 20 and 50 are:
23, 29, 31, 37, 41, 43, 47 (In ascending order) Here, number of observations, n = 7, is odd.
Median = \(\left(\frac{n+1}{2}\right)^{\mathrm{th}}\) observation
= \(\left(\frac{7+1}{2}\right)^{\mathrm{th}}\) observation = 4th observation
Thus, median = 37
Question 12.
A data set has mean = 50 and median = 70. Which of the following is most likely to be true?
(a) Presence of higher end outliers
(b) Presence of lower end outliers
(c) Data is balanced
(d) None of these
Solution:
(b) Presence of lower end outliers
Given, for a data set, mean = 50 and median = 70.
In this data set, the mean is much lower than the median (50 < 70).
The median tells us where the middle of the data is.
The mean is sensitive to outliers and gets pulled in their direction.
Because the mean has been pulled down to 50 (below the median), there must be very small numbers (lower-end outliers) dragging the average down.
Question 13.
The following bar graph shows the rainfall at six selected locations (A, B, C, D, E and F) in certain months.
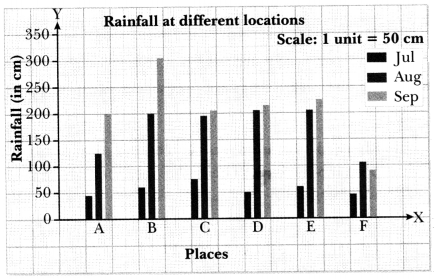
Which of the following statements is correct?
(a) July rainfall exceeds August rainfall by 100 cm at each location.
(b) September rainfall exceeds August rainfall by 50 cm at each location.
(c) July rainfall is lower than August rainfall at each location.
(d) None of the above
Solution:
(c) July rainfall is lower than August rainfall at each location.
From the bar graph, comparing July, August, and September rainfalls at each location A to F, we observe:
- At every location, the August bar is higher than the July bar, i.e. July rainfall never exceeds August rainfall.
- Also, July rainfall is lower than August rainfall in each location.
- September rainfall is not exactly 50 cm more than August at each location.
Question 14.
A bar graph represents the daily water consumption (in litres) of a household.
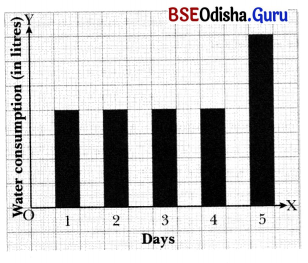
Which conclusion is most logically sound?
(a) Mean = Median
(b) Mean > Median
(c) Median > Mean
(d) Mean and Median cannot be compared
Solution:
(b) Mean > Median
From the graph, we observe that the water consumption on days 1, 2, 3 and 4 are the same (bars of same height), while the water consumption on day 5 is the highest (longest bar).
As the water consumption on day 5 is higher than the water consumption on other days, it will pull the mean upward.
However, the median water consumption will lie in middle.
Hence, Mean > Median.
Question 15.
A bar graph uses the scale: 1 unit =10 children on y-axis.
If the scale is changed to 1 unit = 20 children, then:
(a) the data values change
(b) the order of bars changes
(c) the height of bars changes
(d) the graph becomes incorrect
Solution:
(c) the height of bars changes
If scale is changed to 1 unit = 20 children, the height of bars will reduce in size, but the data values and order of bars remain unchanged.
So, only the height of bars will change.
Question 16.
The given double bar graph represents the average rainfall of two cities in 5 months.
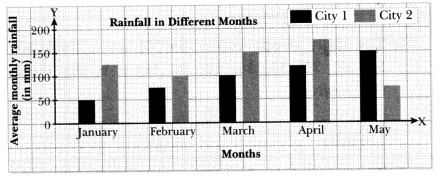
Which city sees increase in rainfall each month from January to May?
(a) City 1
(b) City 2
(c) Both city 1 and city 2
(d) Neither city 1 nor city 2
Solution:
(a) City 1
From the given bar graph:
Rainfall in City 1 increases steadily from January to May.
Rainfall in City 2 decreases from January to February, then increases from February to March to April and then again decreases in May.
Question 17.
The data given below shows the time (in minutes), taken by nine students to go to school from their homes. Which statement about the data is/are true?
115, 65, 225, 75, 115,65,155,125,115
(i) Median is 115.
(ii) The observation 65 is lowest observation.
(iii) The range of the data is 160.
(iv) The range of the data is 90.
Choose the correct option from the following:
(a) (i), (ii) and (iii)
(b) (i) and (iii) only
(c) (ii) and (iv) only
(d) (iv) only
Solution:
(a) (i), (ii) and (iii)
Arranging the data in ascending order, we get 65, 65, 75, 115, 115, 115, 125, 155, 225
Here, number of observations, n = 9, is odd.
∴ Median = \(\left(\frac{9+1}{2}\right)^{\text {th }}\) observation
= \(\left(\frac{10}{2}\right)^{\text {th }}\) observation = 5th observation =115
In the given data set, lowest observation = 65 and highest observation = 225.
So, the range of data set
= Highest value- Lowest value
= 225 – 65 = 160
Thus, statements (i), (ii) and (iii) are true.
Question 18.
The dot plots below show the distribution of the number of pockets on clothing for a group of boys and for a group of girls.
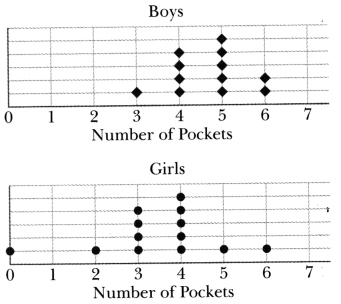
Based on the dot plots, which of the following statements are true?
(i) The data varies more for the girls than for the
(ii) The median number of pockets for the boys is more than that for the girls.
(iii) The mean number of pockets for the girls is more than that for the boys.
(iv) The maximum number of pockets for boys is greater than that for the girls.
Choose the correct option from the following:
(a) (i) and (ii)
(b) (iii) and (iv)
(c) (ii) and (iv)
(d) (i) and (iii)
Solution:
(a) (i) and (ii)
For boys: 3, 4, 4, 4, 4, 5, 5, 5, 5, 5, 6, 6
Range = highest value-lowest value = 6 – 3 = 3
For girls: 0, 2, 3, 3, 3, 3, 4, 4, 4, 4, 4, 5, 6
Range = highest value-lowest value = 6 – 0 = 6
As the range for girls is higher than the range for boys, the data for girls is more variable than that for boys.
For median:
Number of boys, n = 12, which is even
∴ Median number of pockets for the boys
= \(\frac{\left(\frac{12}{2}\right)^{\text {th }} \text { value }+\left(\frac{12}{2}+1\right)^{\text {th }} \text { value }}{2}\)
= \(\frac{6^{\text {th }} \text { value }+7^{\text {th }} \text { value }}{2}\)
= \(\frac{5+5}{2}=\frac{10}{2}\) = 5
Now, number of girls =13, which is odd.
∴ Median number of pockets for the girls
= \(\left(\frac{13+1}{2}\right)^{\text {th }}\) observation = 7th observation
= 4
Clearly, the median number of pockets for the boys is more than that for the girls.
For mean:
Total number of pockets for boys
= 3 + 4 + 4 + 4 + 4 + 5 + 5 + 5 + 5 + 5 + 6 + 6
= 3 + 16 + 25 + 12 = 56
∴ Mean number of pockets for boys
= \(\frac{\text { Total number of pockets }}{\text { Number of boys }}=\frac{56}{12}\) ≈ 4.67
Also, total number of pockets for girls
= 0 + 2 + 3 + 3 + 3 + 3 + 4 + 4 + 4 + 4 + 4 + 5 + 6
= 2 + 12 + 20 + 11 = 45
∴ Mean number of pockets for girls
= \(\frac{\text { Total number of pockets }}{\text { Number of girls }}=\frac{45}{13}\) ≈ 3.46
Clearly, the mean number of pockets for the girls is less than that for the boys.
Also, maximum number of pockets for both boys and girls is the same, i.e. 6.
Thus, statements (i) and (ii) are true.
Question 19.
A student’s weekly step counts (in thousands) are: 5, 5, 6, 7, 7, 8, 20
Which of the following will be largely affected by the removal of the outlier?
(i) Mean
(ii) Median
(iii) Range
(iv) None of these
Choose the correct answer from the following:
(a) (i) and (ii)
(b) (ii) and (iii)
(c) (i) and (iii)
(d) (iv) only
Solution:
(c) (i) and (iii)
Observing the given set of data, we see that most numbers are clustered between 5 and 8. The number 20 is much higher than the others and acts as an outlier.
With the presence of an outlier:
Mean steps = \(\frac{5+5+6+7+7+8+20}{7}=\frac{58}{7}\)
= 8.29
The data is already arranged in ascending order.
So, median = 7
Range of data = 20 – 5 = 15
On removing the outlier:
Mean steps: \(\frac{5+5+6+7+7+8}{6}=\frac{38}{6}\) = 6.33
Now, number of observations = 6 is even, so median is average of two middle values.
∴ Median = \(\frac{6+7}{2}=\frac{13}{2}\) = 6.5
Range of data = 8 – 5 = 3
Difference in mean = 8.29 – 6.33 = 1.96
Difference in median = 7 – 6.5 = 0.5
Difference in range = 15 – 3 =12
Therefore, both the mean and the range are largely affected by outliers.
Question 20.
Consider the given dot plot (for 20 students) representing the data of number of pairs of socks owned by a student.
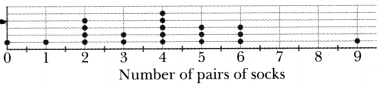
Which of the following statements are correct?
(i) Total 77 pairs of socks are represented in thegiven dot plot.
(ii) Only one student has the highest number of pairs of socks.
(iii) Number of students that own more than 5 pairs is 4.
(iv) Range of the data is 4.
Choose the correct option from the following:
(a) (i), (ii) and (iii)
(b) (i) and (ii) only
(c) (ii) and (iv) only
(d) (iv) only
Solution:
(a)
The total number of pairs of socks
= 0 + 1 + (4 × 2) + (2 × 3) + (5 × 4) + (3 × 5) + (3 × 6) + 9
= 0 + 1 + 8 + 6 + 20 + 15 + 18 + 9 = 77
Since there is only one dot corresponding to 9
i. e. the highest number of pairs of socks, only one student has the highest number of pairs of socks.
The number of students that own more than 5 pairs is 4.
Range of data = Highest value – Lowest value = 9 – 0 = 9
Thus, statements (i), (ii) and (iii) are correct.
Connecting the Dots Class 7 Assertion and Reason Questions
The following questions are Assertion and Reason based questions. Two statements are given, one labelled as Assertion (A) and the other is labelled as Reason (R). Select the correct ansiyer to these questions from the codes (a), (b), (c) and (d) as given below.
(a) Both A and R are true and R is the correct explanation of A.
(b) Both A and R are true but R is not the correct explanation of A.
(c) A is true but R is false.
(d) A is false but R is true.
Question 1.
(A): If two data sets have the same mean, they must have the same sum.
(R): Mean = \(\frac{Sum of observations}{Number of observations}\)
Solution:
(d) A is false but R is true.
We know, Mean = \(\frac{Sum of observations}{Number of observations}\)
Thus, Reason (R) is true.
For two data sets to have the same mean, the ratio of their sum to the number of observations must be equal. However, if the number of observations (n) is different for each set, their sums will also be different even if the mean is the same. For example:
Set A: 10, 10 (Sum = 20, Number of observations = 2, Mean =10)
Set B: 10, 10, 10 (Sum = 30, Number of observations = 3, Mean = 10)
Both have the same mean, but different sums. Thus, the Assertion (A) is false.
Question 2.
(A): If a data set has an outlier at the higher end, then the mean is more likely to be greater than the median.
(R): The outlier at the higher end does not affect the mean.
Solution:
(c) A is true but R is false.
We know that, if in a dataset, the outlier lies at the higher end, the mean is pulled upward.
Because of this, the mean becomes greater than the middle value, i.e. the median.
Thus, Assertion (A) is true, but Reason (R) is false.
Question 3.
(A): An inappropriate scale on a column graph can make the data interpretation misleading.
(R): The scale decides the value represented by each unit length on the axis.
Solution:
(a) Both A and R are true and R is the correct explanation of A.
The height of the bars of column graph is entirely dependent on the chosen scale. Since the scale determines the value represented by each unit on the axis, an inappropriate scale leads to confusion while interpreting the graph.
Thus, both the Assertion (A) and the Reason (R) are true, and Reason (R) is the correct explanation of Assertion (A).
Connecting the Dots Class 7 Fill in the Blanks
Question 1.
If there are even number of observations in a data set, then median is average of _____ middle values.
Solution: two
When number of observations in a data set is even, there exists two middle values.
Thus, if there are even number of observations in a data set, then median is average of two middle values.
Question 2.
Mean of first five multiples of 2 is _________ .
Solution: 6
The first five multiples of 2 are 2, 4, 6, 8, 10.
∴ Mean = \(\frac{Sum of first five multiples of 2}{5}\)
= \(\frac{2+4+6+8+10}{5}=\frac{30}{5}\) = 6
Thus, mean of first five multiples of 2 is 6.
Question 3.
A question is said to be statistical only if its answer is expected to show _________.
Solution: variability
A question is said to be statistical only if its answer is expected to show variability.
Question 4.
The mecpan Qf first 15 odd natural numbers is ________ .
Solution: 15
The first 15 odd numbers in ascending order are: 1, 3, 5, 7, 9, 11, 13, 15, 17, 19, 21, 23, 25, 27, 29 Here, the number of observations, n = 15, is odd.
∴ Median = \(\left(\frac{15+1}{2}\right)^{\text {th }}\)
Observation = 8th observation =15
Thus, the median of the first 15 odd natural numbers is 15.