
Odisha State Board CHSE Odisha Class 11 Math Notes Chapter 15 Statistics will enable students to study smartly.
CHSE Odisha 11th Class Math Notes Chapter 15 Statistics
Measures Of Central Tendency:
A measure of central tendency or average is a value, that is the representative of whole data and signifies its characteristics.
Different measures of central tendency are: (a) Mean (b) Median (c) Mode.
(a) Mean (Arithmetic Mean):
Mean of ungrouped data: The mean of ‘n‘ observations x1, x2 …..xn = \(\bar{x} \frac{\sum_{i=1}^n x_i}{N}\)
Mean of grouped data:
(i) Direct Method
If xi are the mid values of the intervals with frequency fi then the mean \(\bar{x}=\frac{1}{N} \sum_{i=1}^n f_i x_i\)
(ii) Shortcut Methods:
(1) Assumed mean method
Mean = \(\overline{\mathrm{x}}=\mathrm{A}+\frac{1}{\mathrm{~N}} \sum_{\mathrm{i}=1}^{\mathrm{n}} \mathrm{f}_{\mathrm{i}} \mathrm{d}_{\mathrm{i}}\)
where A = the assumed mean ⇒ di = xi – A
(iii) Step Deviation Method:
Mean = \(\overline{\mathrm{x}}=\mathrm{A}+\frac{\mathrm{C}}{\mathrm{N}} \sum_{\mathrm{i}=1}^{\mathrm{n}} \mathrm{f}_{\mathrm{i}} \mathrm{u}_{\mathrm{i}}\)
where A = The assumed mean, C = Class width
ui = \(\frac{d_i}{C}=\frac{x_i-A}{C}\)
(b) Median
(i) Median of ungrouped data:
Let n is the number of observation.
Arrange the observations in ascending or descending order.
⇒ If n is odd, Median = \(\left(\frac{\mathrm{n}+1}{2}\right)^{\mathrm{th}}\) observation.
⇒ If n is even, Median = \(\frac{\left(\frac{\mathrm{n}+1}{2}\right)^{\mathrm{th}} \text { observation }+\left(\frac{\mathrm{n}}{2}+1\right)^{\mathrm{th}} \text { observation }}{2}\)
(ii) Median of grouped data
- Get \(\frac{\mathrm{N}}{2}\) and cummulative frequencies of all classes.
- Get the Median class.
Median class = The class whose cumulative frequency is just greater than (or near to) \(\frac{\mathrm{N}}{2}\).
Median = l + \(\frac{\mathrm{m}-\mathrm{c}}{\mathrm{fm}}\) × h,
where l = lower limit of median class .
h = Class width of median class M = \(\frac{\mathrm{N}}{2}\).
c = Cummulative frequency of the class preceeding the median class.
fm = Frequency of the median class.
(c) Mode
Mode is the most frequent value.
⇒ We can find mode using the empirical formula:
Mode = 3 Median – 2 Mean.
(i) Mode for Grouped data
⇒ Get the Modal class: It is the class with maximum frequency.
Mode = \(l+\frac{\mathrm{f}_{\mathrm{m}}-\mathrm{f}_1}{2 \mathrm{f}_{\mathrm{m}}-\mathrm{f}_1-\mathrm{f}_2} \times \mathrm{c}\)
where l = lower limit of modal class.
fm = Frequency of modal class.
f1 = Frequency of the class just preceeding modal class.
f2 = Frequency of the class just suceeding modal class.
![]()
Measure Of Dispersion:
The variability or scatter or spreading of data is known as dispersion.
Some of the measures of dispersion are:
(a) Range
(b) Mean deviation
(c) Variance
(d) Standard deviation
(a) Mean deviation: Mean deviation is the mean of absolute deviations of all observations from a central value (Mean or Median).
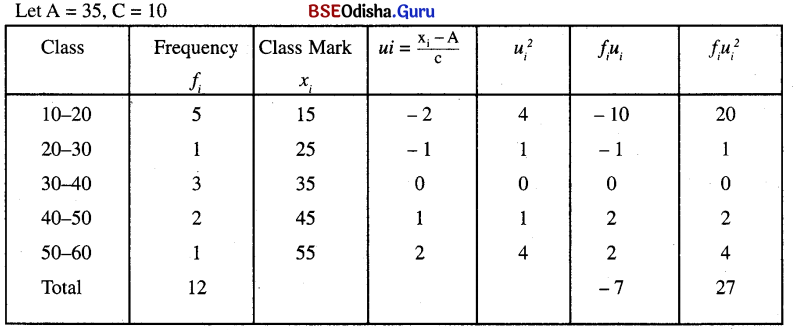
For Group – B
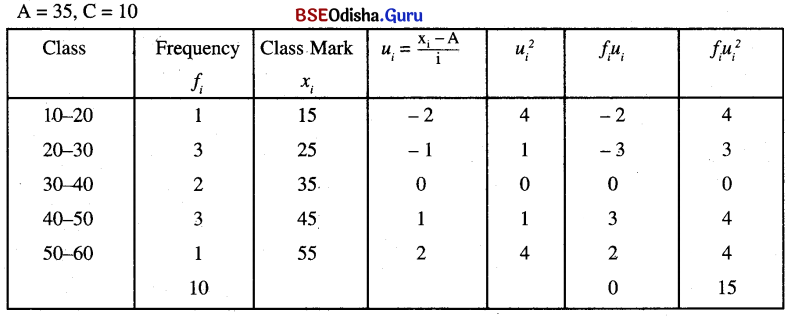
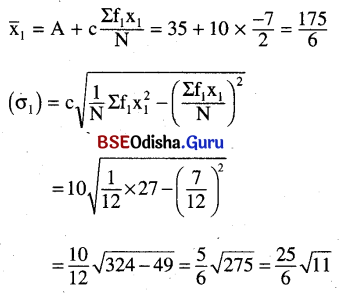
A = 35, C = 10
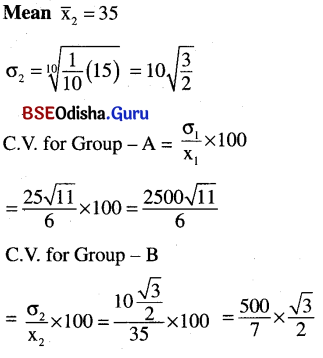
As C. V of Group – A is more, the data for group – A is more dispersed
For Group – A
![]()
Analysis Of Frequency Distribution:
Coefficient of variation (C. V) = \(\frac{\sigma}{x}\) × 100
Note:
- The distribution with greater C. V is more variable or dispersed and lesser C. V is less variable or more consistent.
- If two distributions have same mean then they can be compared on the basis of their standard deviation.