
Students can refer to BSE Odisha Class 6 Math Solution and Ganita Prakash Chapter 4 Data Handling and Presentation Class 6 Question Answer to understand textbook questions step by step.
Class 6 Maths Chapter 4 Data Handling and Presentation Solutions
Ganita Prakash Class 6 Chapter 4 Solutions
Class 6 Maths Ganita Prakash Chapter 4 Solutions Data Handling and Presentation
Question 1.
Shri Nilesh is a teacher. He decided to bring sweets to the class to celebrate the new year. The sweets shop nearby has jalebi, gulab jamun, gujiya, barfi, and rasgulla. He wanted to know the choices of the children. He wrote the names of the sweets on the board and asked each child to tell him their preference. He put a tally mark ‘ | ’ for each student and when the count reached 5, he put a line through the previous four and marked it as 
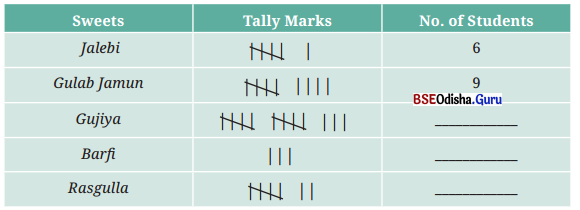
Complete the table to help Shri Nilesh to purchase the correct numbers of sweets.
(a) How many students chose jalebi? _______
(b) Barfi was chosen by _______ students?
(c) How many students chose gujiya? _______
(d) Rasgulla was chosen by _______ students?
(e) How many students chose gulab jamun? _______
Solution:
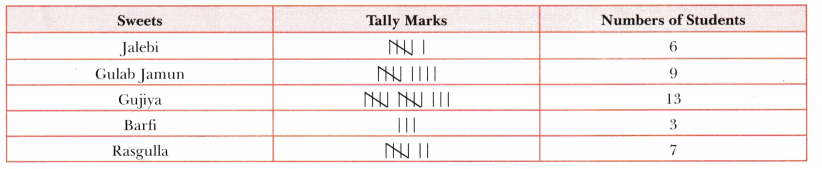
(a) It is clear from the table, Jalebi was chosen by 6 students.
(b) It is clear from the table, Barfi was chosen by 3 students.
(c) Gujiya was chosen by 13 students.
(d) Rasgulla was chosen by 7 students.
(e) Gulab jamun was chosen by 9 students.

Question 2.
Magan Bhai sells kites at Jamnagar. Six shopkeepers from nearby villages come to purchase kites from him. The number of kites he sold to these six shopkeepers are given below.
| Shopkeeper | Number of Kites sold |
| Chaman | 250 |
| Rani | 300 |
| Rukhsana | 100 |
| Jasmeet | 450 |
| Jetha Lai | 250 |
| Poonam Ben | 700 |
Prepare a pictograph using the symbol  to represent 100 kites.
Answer the following questions:
(a) How many symbols represent the kites that Rani purchased?
(b) Who purchased the maximum number of kites?
(c) Who purchased more kites, Jasmeet or Chaman?
(d) Rukhsana says Poonam Ben purchased more than double the number of kites that Rani purchased. Is she correct? Why?
Solution:
Required pictograph is given below.
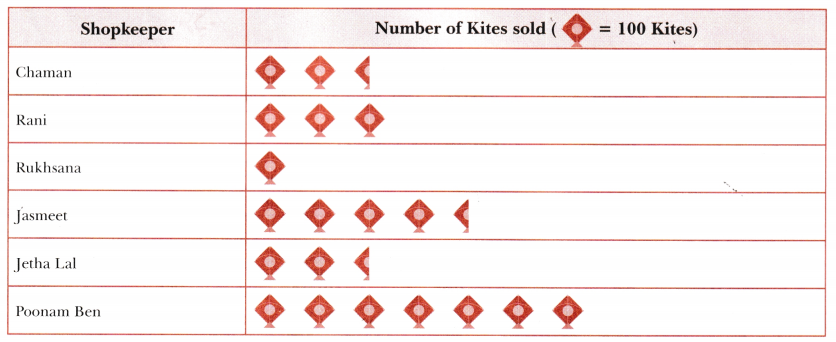
(a) Since Rani purchased 300 kites, it is clear from the pictograph, 3 symbols represent the kites that Rani purchased.
(b) The shopkeeper who purchased the maximum number of kites is the one with the most symbols in pictograph. It is clear from the pictograph that Poonam Ben purchased the maximum number of kites (7 × 100 = 700 kites).
(c) Number of kites purchased by Jasmeet = 450 Number of kites purchased by Chaman = 250 Jasmeet purchased more kites.
(d) Number of kites purchased by Poonam Ben = 700 Number of kites purchased by Rani = 300
Hence, Rukhsana is correct as 700 kites is more than double of 300 kites (300 × 2 = 600).
Question 3.
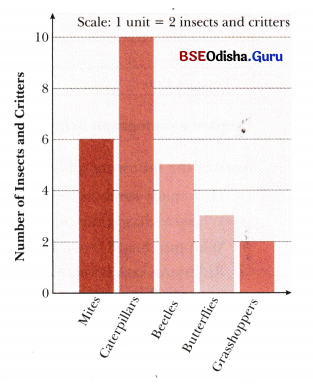
Samantha visited a tea garden and collected data of the insects and critters she saw there. Here is the data she collected —
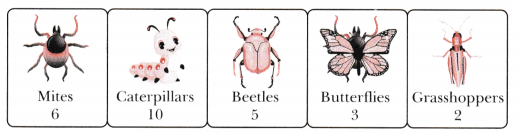
Help her prepare a bar graph representing this data.
Solution:
To prepare a bar graph representing the given data, follow the point given below.
(i) Draw a horizontal line labeled, ‘Insects and Critters’ with each type of insect or critter evenly spaced.
(ii) Draw a vertical line labeled ‘Number of insects and critters seen’ with numbers starting from 0 up to the maximum number seen (in this case, 10) evenly spaced.
(iii) For each insect or critter, draw a bar that rises to the number seen. For example, the bar of caterpillars should reach up to 10.
Required bar graph is given alongside.
Question 4.
Chinu listed the various means of transport that passed across the road in front of his house from 9 a.m. to 10 a.m.
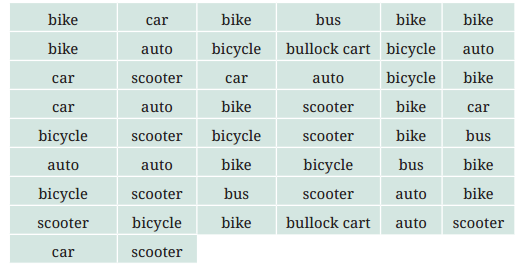
(a) Prepare a frequency distribution table for the data.
(b) Which means of transport was used the most?
(c) If you were there to collect this data, how could you do it? Write the steps or process.
Solution:
(a) Frequency distribution table for the given data is given below:
| Means of transport | Bike | Car | Bus | Auto rickshaw | Bicycle | Bullock Cart | Scooter |
| Frequency | 13 | 6 | 4 | 8 | 8 | 2 | 9 |
(b) The bike has the highest frequency in the table, indicating it was the most common means of transport observed.
(c) To collect this data, you could follow the steps given below. ;
Observation Timeframe: I will choose a specific timeframe, such as 9 a.m. to 10 a.m., to observe the road traffic.
Recording Data: 1 will use a tally chart or counting app to record the type of transport passing by during that hour.
Categorisation: Then I will organise the data into categories (e.g., bike, car, scooter, bus, etc.).
Final Count: After the observation period, I will get the total the number of occurrences for each category.
Analysis: Finally, I prepare a frequency distribution table based on the recorded data for analysis.
Question 5.
The number of girl students in each class of a school is depicted by the pictograph.
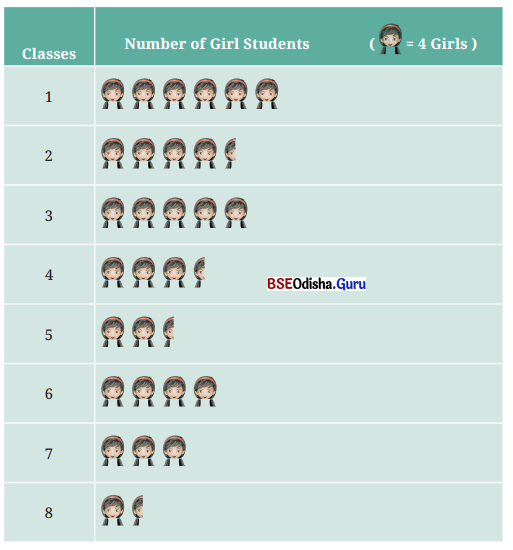
Observe this pictograph and answer the following questions.
(a) Which class has the least number of girl students?
(b) What is the difference between the number of girls in Class 5 and 6?
(c) If two more girls were admitted in Class 2, how would the graph change?
(d) How many girls are there in Class 7?
Solution:
(a) The pictograph shows the least number of symbols for Class 8.
Hence, Class 8 has the least number of girl students.
(b) Girl students in Class 5 = 2.5 × 4 = 10 Girl students in Class 6 = 4 × 4 = 16
Hence, there are 6 more girls in Class 6 than in Class 5.
(c) Here, adding 2 more girls would increase the count by 2 and requires a half additional symbol.
The pictograph would show half additional symbol for class 2, assuming each symbol represent 4 girls.
(d) Girl students in Class 7 = 3 × 4 = 12.
Data Handling and Presentation Class 6 Extra Questions
Data Handling and Presentation Class 6 Very Short Question Answer
Question 1.
Define the following terms:
(i) Observations
(ii) Data
Solution:
(i) Observations are the individual pieces of information we collect.
For example, if we ask five friends their ages, each friend’s age is one observation.
(ii) Any collection of facts, numbers, measures, observations or other descriptions of things that convey information about those things is called data.
Question 2.
Define the following terms:
(i) Tabulation of data
(ii) Tally marks
Solution:
(i) Tabulation of data is the process of systematically arranging data into rows and columns within a table to make it easier to understand, compare and analyse.
(ii) Tally marks are short vertical lines used to count items. Each time we count one item, we draw one line (|). After four lines (| | | |), we draw a oblique line (\) across them to show five.
Question 3.
Define the following terms:
(i) Raw data
(ii) Array
Solution:
(i) Raw data is the information as we first collect it (original form), before we sort or arrange it.
For example, writing ages on a sheet of paper as friends tell you, without putting them in any order.
(ii) Organising the data by arranging it in ascending or descending order is called an array.
For example, Meenal arranged the shoe sizes of the students in ascending order as follows:
3, 3, 3, 4, 4, 4, 4, 4, 4, 4, 4, 4, 5, 5, 5, 5, 5, 5, 5, 5, 5, 5, 6, 6, 6, 6, 7
Question 4.
Define the following terms:
(i) Frequency of observation
(ii) Frequency distribution
Solution:
(i) Frequency of observation tells us how many times a particular value appears in the data. For example, if the age ‘12’ appears three times in the list, then the frequency of age ‘12’ is 3.
(ii) Frequency distribution is a table that shows each value (or group of values) and how often it appears (frequency). For example:
| Age | Frequency |
| 10 | 2 |
| 11 | 1 |
| 12 | 3 |
Question 5.
A die was thrown 20 times and the following outcomes were noted:
1, 2, 5, 1, 6, 2, 3, 4, 2, 4, 2, 5, 6, 6, 6, 2, 3, 1, 1, 5
Represent the above data in the form of frequency distribution.
Solution:
| Outcome | Frequency |
| 1 | 4 |
| 2 | 5 |
| 3 | 2 |
| 4 | 2 |
| 5 | 3 |
| 6 | 4 |
Question 6.
Enlist 1 advantage and 1 disadvantage of presentation of data through pictograph.
Answer:
1 advantage and 1 disadvantage of pictograph are as follows:
| Advantage | Disadvantage |
| 1. Pictorial representation makes it easier to understand the data. | 1. Drawing a pictograph is time consuming. |
Data Handling and Presentation Class 6 Short Question Answer
Question 1.
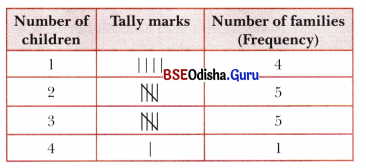
Given below is the data showing the number of children in 15 families of a colony.
2, 3, 1, 1, 2, 3, 2, 3, 3, 4, 1, 2, 2, 1, 3
Arrange the above data in ascending order and then form a tally table.
Solution:
Given data (number of children in 15 families) is as follows: 2, 3, 1, 1, 2, 3, 2, 3, 3, 4, 1, 2, 2, 1, 3
(i) Data in ascending order: 1, 1, 1, 1, 2, 2, 2, 2, 2, 3, 3, 3, 3, 3, 4.
(ii) Given data in tabular form is shown below:
Question 2.
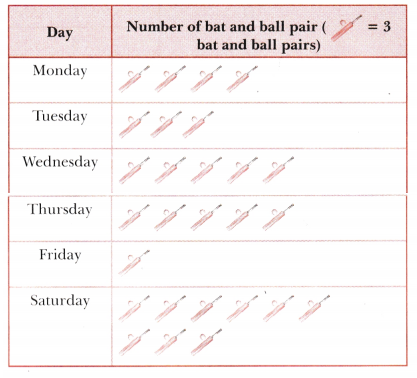
The number of cricket bat and ball pairs, sold by a shopkeeper during a week are given below:
| Day | Mon. | Tue. | Wed. | Thu. | Fri. | Sat. |
| Number of bat and ball pair sold | 12 | 9 | 15 | 15 | 3 | 27 |
Decide the scaling and draw a pictograph to represent the given data.
Solution:
Question 3.
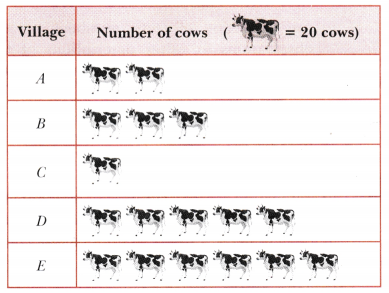
Total number of cows in five villages are as follows:
| Village | A | B | C | D | E |
| Number of cows | 40 | 60 | 20 | 100 | 120 |
Decide the scale and draw a pictograph to represent the given data.
Solution:
Question 4.
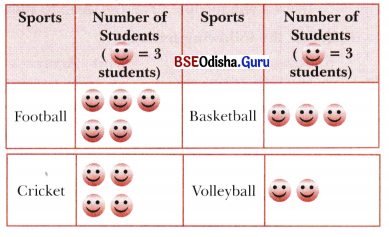
Following pictograph shows the data of the number of students who like a particular sport.
Answer the following questions:
(i) How many students like cricket?
(ii) How many more students like basketball than volleyball?
Solution:
(i) Number of symbols for cricket = 4
Students who like cricket = 4 × 3= 12
(ii) Number of symbols for basketball = 3
∴ Students who like basketball = 3 × 3 = 9
Number of symbols for volleyball = 2
∴ Students who like volleyball = 2 × 3 = 6
Difference = 9 – 6 = 3
Hence, 3 more students like basketball than volleyball.
Question 5.
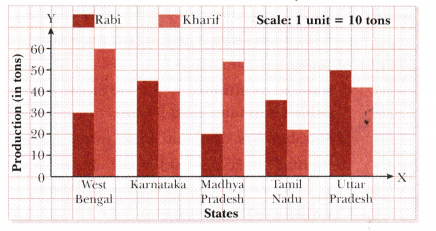
The bar graph below shows the production of Kharif and Rabi crops (in tons) in 5 different states in India. Draw a table that represents the data in the bar graph.
Solution:
Table for the given bar graph can be created as follows:
| States | Rabi crops (in tons) | Kharif crops (in tons) |
| West Bengal | 30 | 60 |
| Karnataka | 45 | 40 |
| Madhya Pradesh | 20 | 54 |
| Tamil Nadu | 36 | 22 |
| Uttar Pradesh | 50 | 42 |
Data Handling and Presentation Class 6 Long Question Answer
Question 1.
The weights of newborn babies (in Kg) in a hospital on a particular day are as follows:
2.1, 2.5, 3.5, 2.7, 2.9, 3.1, 2.6, 2.5, 2.8, 2.3, 2.9, 3.3, 3.4, 2.7, 2.8
Answer the following questions:
(i) How many babies are born on that day?
(ii) Arrange the above data in descending order.
(iii) Determine the highest weight.
(iv) Determine the lowest weight.
(v) Determine the range of weight.
(vi) How many babies weigh below 2.5 kg?
Solution:
(i) There are 15 babies born on that day.
(ii) Writing the weights from highest to lowest:
3.5, 3.4, 3.3, 3.1, 2.9, 2.9, 2.8, 2.8, 2.7, 2.7, 2.6, 2.5, 2.5, 2.3, 2.1
(iii) The highest weight is the first weight in the descending order of weights.
Highest weight = 3.5 kg
(iv) The lowest weight is the last weight in the descending order of weights.
Lowest weight = 2.1 kg
(v) We know, range = highest value – lowest value
∴ Range of weight = highest weight – lowest weight
= 3.5 kg – 2.1 kg = 1.4 kg
(vi) The weights below 2.5 kg are 2.1 kg and 2.3 kg. So, the required number of babies is 2.
Question 2.
Study the following pictograph:
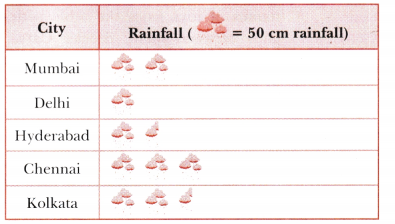
Answer the following questions:
(i) In which city was the rainfall maximum and how much?
(ii) In which city was the rainfall minimum and how much?
(iii) Which cities had rainfall of more than 50 cm?
Solution:
(i) Chennai has three full icons, which is maximum.
∴ Rainfall in Chennai = 3 × 50 cm = 150 cm
(ii) Delhi has one full icon, which is minimum.
∴ Rainfall in Delhi = 1 × 50 cm = 50 cm.
(iii) Mumbai has 2 full icons.
∴ Rainfall in Mumbai = 2 × 50 cm = 100 cm (which is greater than 50 cm)
Hyderabad has 1 full and 1 half icons.
∴ Rainfall in Hyderabad = 50 cm + 25 cm = 75 cm (which is greater than 50 cm) Chennai has 3 full icons.
∴ Rainfall in Chennai = 50 × 3 = 150 cm (which is greater than 50 cm)
Kolkata has 2 full and 1 half icons.
∴ Rainfall in Kolkata =100 cm + 25 cm =125 cm (which is greater than 50 cm)
Hence, Mumbai, Hyderabad, Chennai, and Kolkata had rainfall of more than 50 cm.
Question 3.
In a shop, there are 5 different types of toys. The number of each toy is given in the table below. Construct a bar graph representing this data. Use appropriate scaling.
| Toys Name | Blocks | Cars | Dolls | Balls | Bikes |
| Number of Toys | 40 | 48 | 60 | 35 | 30 |
Solution:
The required bar graph can be easily created using the following steps:
Step 1: On a graph sheet draw two mutually perpendicular lines, a horizontal and a vertical line.
Step 2: Label horizontal line as ‘Toys name’ & write names of toys from the table with equal gaps between them: Blocks, Cars, Dolls, Balls, Bikes. Label vertical line as ‘Number of Toys’.
Step 3: Scaling: Choose a suitable scale to show the number of toys.
Here, we take: 1 unit (1 big division) = 10 toys. Each big division is further divided into 10 sub-divisions, representing 1 toy.
Step 4: Calculate the height of each bar:
10 toys = 1 large divisions
∴ 1 toy = \(\frac{1}{10}\) large divisions
= 1 sub-division
Now, the height of the bar for Blocks
= 40 × (\(\frac{1}{10}\)) = 4 large divisions
The height of the bar for Cars
48 × (\(\frac{1}{10}\)) = 4 large divisions and 8 sub-divisions
The height of the bar for Dolls = 60 × (\(\frac{1}{10}\)) = 6 large divisions
The height of the bar for Balls = 35 × (\(\frac{1}{10}\)) = 3 large divisions and 5 sub-divisions
The height of the bar for Bikes = 30 × (\(\frac{1}{10}\))
Step 5: Now draw vertical bars for each toy using the heights calculated above. Make sure the bars are of equal width and there is equal spacing between them.
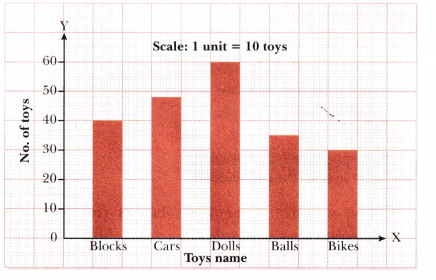
Question 4.
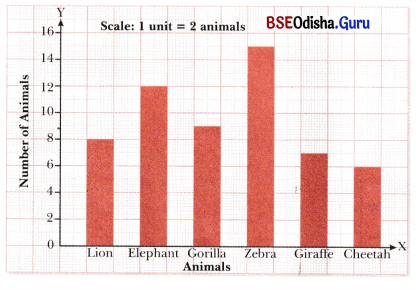
The zookeeper in Delhi is preparing a presentation for higher officers on the number of animals in the zoo. He intends to create a bar graph for better visualisations. The number of each animal is given below in the table. Construct a bar graph for the table.
| Animals | Number of Animals |
| Lion | 8 |
| Elephant | 12 |
| Gorilla | 9 |
| Zebra | 15 |
| Giraffe | 7 |
| Cheetah | 6 |
Solution:
Step 1: Take a graph sheet and draw two mutually perpendicular lines, a horizontal line and a vertical line.
Step 2: Label the horizontal line as ‘Animals’ and write the names of the animals from the table with equal gaps between them: Lion, Elephant, Gorilla, Zebra, Giraffe, Cheetah Label the vertical lines ‘ Number of Animals’.
Step 3 (Scaling) : Choose a suitable scale to show the number of animals.
Here, we take: 1 unit (1 large division)
= 2 animals
∴ 1 animal = \(\frac{1}{2}\) unit = 1 sub-division
This scale helps us draw the graph clearly.
Step 4: Calculate the height of each bar using the scale:
Height of the bar for the Lion = 8 ÷ 2 = 4 large divisions
Height of the bar for the Elephant = 12 ÷ 2 = 6 large divisions
Height of the bar for the Gorilla = 9 ÷ 2 = 4 large divisions and 1 subdivision
Height of the bar for the Zebra = 15 ÷ 2 = 7 large divisions and 1 sub-division
Height of the bar for the Giraffe = 7 + 2 = 3 large divisions and 1 subdivision
Height of the bar for the Cheetah = 6 + 2 = 3 large divisions
Step 5: Now draw vertical bars for each animal using the heights calculated above. Make sure the bars are of equal width and there is equal spacing between them.
Question 5.
The following bar graph shows the revenue of your country from exports of various items in 1 year. (1 unit = 10 crore rupees)
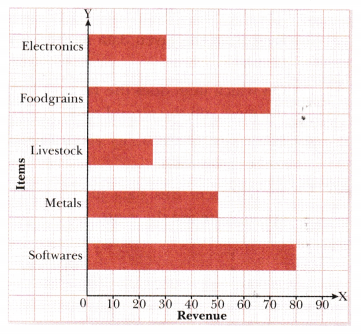
(a) Write the information given by the bar graph in a table.
(b) What is the difference between the maximum revenue and the minimum revenue?
(c) What is the total revenue from exports?
Solution:
(a) The required table is shown below:
| Items | Revenue (Rupees in crores) |
| Electronics | 30 |
| Foodgrains | 70 |
| Livestock | 25 |
| Metals | 50 |
| Softwares | 80 |
(b) From the table, it can be observed that the maximum revenue was generated by the export of software, i.e. 80 crore rupees.
Also, the minimum revenue was generated by the exports of livestock, i.e. 25 crore rupees.
∴ The difference between the revenue from software and livestock = 80 – 25 = 55 crore
(c) Total revenue from exports can be calculated by summing up the revenues from all the commodities.
∴ Total revenue from exports = 30 + 70 + 25 + 50 + 80 = 255 crore rupees
Question 6.
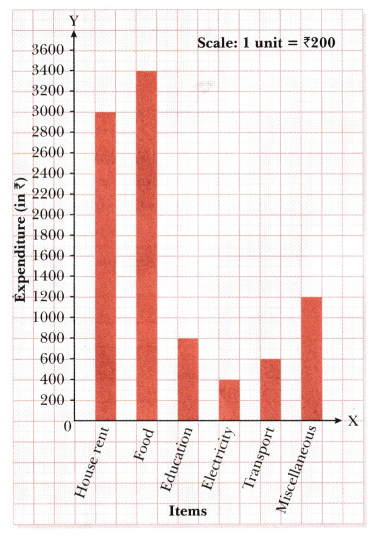
The table shows how much money Imran’s family spends each month on different items:
| Items | Expenditure (in ₹) |
| House rent | 3,000 |
| Food | 3,400 |
| Education | 800 |
| Electricity | 400 |
| Transport | 600 |
| Miscellaneous | 1,200 |
Answer the following questions:
(a) Represent the given data in the form of a bar graph
(b) On which item does the Imran’s family spend the most and the second most?
(c) Is the cost of electricity about one half of the cost of education?
Solution:
(a) To represent this data in the form of a bar graph, here are the steps:
Step 1: Draw two perpendicular lines, one horizontal and one vertical.
Step 2: Along the horizontal line, mark the ‘items’ with equal spacing between them and mark the corresponding expenditures along the vertical line.
Step 3: Take bars of the same width, keeping a uniform gap between them.
Step 4: Choose a suitable scale along the vertical line. Let, 1 unit length = ₹ 200, and then mark and write the corresponding values (₹ 200, ₹400, etc.) representing each unit length and calculate the heights of the bars for various items as shown below:
| House rent | 3000 ÷ 200 | 15 units |
| Food | 3400 ÷ 200 | 17 units |
| Education | 800 ÷ 200 | 4 units |
| Electricity | 400 ÷ 200 | 2 units |
| Transport | 600 ÷ 200 | 3 units |
| Miscellaneous | 1200 ÷ 200 | 6 units |
Here is the bar graph that we obtained based on the above steps.
(b) From the given data, we can say that on food Imran’s family spend the most and on house rent they spend the second most.
(c) Yes. As the cost of electricity is ₹ 400 and the cost of eduction is ₹ 800, we can say that the cost of electricity is about one-half the cost of education.
Question 7.
Your school is collecting data on various transportation options that students used to opt. The table below shows the data collected by you. Prepare a bar graph to be given to your school principal, also use appropriate scaling.
| Transportation | Number of Students |
| Bus | 200 |
| Cycle | 50 |
| Walk | 80 |
| Auto | 120 |
| Car | 40 |
Solution:
The required bar graph can be easily created using the following steps:
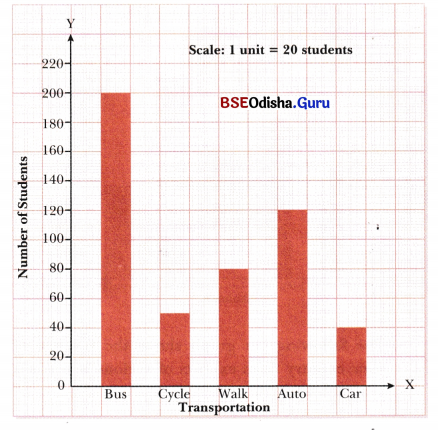
Step 1: Take a graph sheet and draw two mutually perpendicular lines, a horizontal line and a vertical line.
Step 2: Label the horizontal line as‘Transportation’ and write the names from the table with equal gaps between them: Bus, Cycle, Walk, Auto, Car.
Label the vertical line as ‘Number of Students’.
Step 3: (Scaling): Choose a suitable scale to show the number of students.
Here, we take:
1 unit (1 big division) = 20 students (This helps us fit large numbers like 200 easily on the graph.)
Step 4: Calculate the height of each bar:
= 200 × (\(\frac{1}{20}\)) = 10 large divisions
Height of the bar for the cycle
= 50 × (\(\frac{1}{20}\))= 2 large divisions and 5 sub-divisions
Height of the bar for the walk
= 80 × (\(\frac{1}{20}\)) = 4 large divisions
Height of the bar for the auto
= 120 × (\(\frac{1}{20}\)) = 6 large divisions
Height of the bar for the car
= 40 × (\(\frac{1}{20}\)) = 2 large divisions
Step 5: Now draw vertical bars for each mode of transportation using the heights calculated above. Make sure the bars are of equal width and there is equal spacing between them.
Question 8.
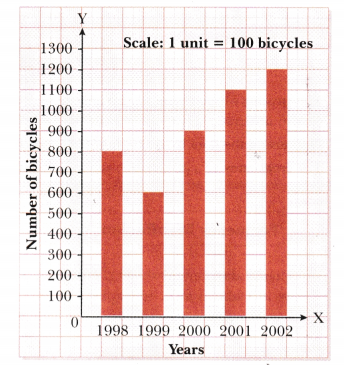
The table below displays the number of bicycles produced at a factory from 1998 to 2002.
| Year | 1998 | 1999 | 2000 | 2001 | 2002 |
| No. of Bicycles | 800 | 600 | 900 | 1100 | 1200 |
Answer the following questions:
(a) Create a bar graph to represent this information. Select your preferred scale.
(b) Which year had the greatest number of bicycles produced?
(c) Which year had the least number of bicycles produced?
Solution:
(a) To represent this data in the form of a bar
Step 1: Draw two perpendicular lines, one horizontal and one vertical.
Step 2: Along the horizontal line, mark the ‘years’ with equal spacing between them and mark the corresponding ‘No. of bicycles’ along the vertical line.
Step 3: Take bars of the same width, keeping a uniform gap between them.
Step 4: Choose a suitable scale along the vertical line. Let, 1 unit length =100 bicycles, and then mark and write the corresponding values (100 bicycles, 200 bicycles, etc.) representing each unit length and calculate the heights of the bars for various years as shown below:
| 1998 | 800 ÷ 100 | 8 units |
| 1999 | 600 ÷ 100 | 6 units |
| 2000 | 900 ÷ 100 | 9 units |
| 2001 | 1100 ÷ 100 | 11 units |
| 2002 | 1200 ÷ 100 | 12 units |
(b) The greatest number of bicycles produced in 2002.
(c) The least number of bicycles produced in 1999.